-
 Version 5.6

Release Notes
D&B Direct Monitor 5.6 release. This release has new features and bug fixes from the previous versions.
Version: D&B Direct Monitor 5.6
Release date: September 20, 2021
Features
| # | Description |
|---|---|
| 1 | Role base access to the application – User & Admin base role restrictions |
| 2 | Application defined 404 error page implementation |
| 3 | Remove user privilege to add "STP login Name" from Reference Creation |
| 4 | Job Failure Email notification for Registration |
| 5 | Prevent user to perform the action while the page is loading |
| 6 | Below show defect fixes. 562,592,618,743,785,1001,1133,1171,1174,1175 ,1187 ,1195 ,1202 ,1203 ,1204 ,1205 ,1209 ,1211 ,1213 ,1225 ,1227 ,1228 ,1229 ,1230 ,1235 ,1236 ,1237 ,1238 |
Known Issues
| Defect# | Description |
|---|---|
Installation Guide
This guide explains the process involved in performing the installation of D&B Direct Monitor application (also referred to as “Monitor”).
Before you Begin
The following checklist contains list of information that will be required during the installation process. Please ensure you have this information beforehand entered in the checklist for uninterrupted installation. User may choose to keep password information confidential.
Prerequisites for the Installation
System Requirements
The section defines the software requirements and necessary configuration for the installation of the Monitor server.
- Permission to install Tomcat application server (version 9.0.37) at the desired location
- Oracle Java Version - JDK 1.8
- Firewall or proxy white list to make API calls to
D&B
- https://direct.dnb.com*
- http://services.dnb.com*
- ftp.dnb.com via SSL port
- Access to port 4000 to access application on tomcat
Hardware Requirements
The minimum hardware configuration for the functioning of the Monitor is:
- Disk Space - Minimum 200MB to install (~20 GB again depending on volume)
- Database size - Minimum 15-20 GB (The space requirement depends on your data volume)
- JVM Memory – Minimum 4GB RAM
- Dual core CPU machine
Pre-Install Checklist (Monitor Schema & Server)
| # | Required information | Description |
|---|---|---|
| 1 | License Key | Monitor product license key received via email from Globalsoft. It is the same license key used for downloading Monitor product bundle |
| 2 | DB Server Host Name | Host name on which DUNS Data schema is stored |
| 3 | DB Server listener port number | Oracle DB listener port (default 1521) |
| 4 | Monitor DB Server Host name | Name of the DB Server on which the Monitor store is deployed. (may be same as source DB Server Host) |
| 5 | Connection type for Monitor schema/user | Connection Type for Monitor schema: SID or Service Name |
| 6 | SID or Service Name for Monitor | Enter SID/Service Name for database server where Monitor schema was created |
| 7 | Connection type for DUNS Data Schema/user | Connection Type for DUNS Data Schema: SID or Service Name |
| 8 | SID or Service Name for DUNS Data Schema | Enter SID/Service Name where DUNS Data Schema was created |
| 9 | TNS Entry for Monitor | TNS name of the oracle server where Monitor schema will be created [ORCL]: |
| 10 | TNS Entry for DUNS Data Schema | Enter Oracle Server TNS name for DUNS Data Schema [ORCL]: |
| 11(a) | SYS DBA User Name | Database Administrator User Name. This is required to install Monitor schema and setup certain permissions to access system table & DUNS Data Schema |
| 11(b) | SYS DBA User Password | Password for Database Administrator User |
| 12 | Source for DUNS name | Name of the DUNS Data Schema that will be monitored by Monitor |
| 13 | Monitor Proxy Schema User name | Choose a name for a Database user in the DUNS Data Schema that will be used by the Monitor to connect to the schema. This name will be used by Monitor install process to create a Database proxy Schema |
| 14 | Monitor Proxy Schema password | Choose a password for the above Database user to be used by the Monitor Proxy Schema |
| 15 | Database username of the Monitor User schema | Choose a name for the schema that will store in the Monitor data. This name will be used by the Monitor install process to create a Database Schema |
| 16 | Database password of the Monitor User Schema | Choose a password for the schema that will store in the Keystore. This password will be used by the Monitor install process to create a Database Schema |
| 17 | Monitor Data tablespace name | DB Tablespace name which you would like to associate with Monitor schema for storing data (like MDM Hub’s requirement) Either same tablespace as used for MDM Hub, or create new tablespace. |
| 18 | Monitor Index tablespace name | Index Tablespace name which you would like to associate with Monitor schema for storing index data (like MDM Hub’s requirement) Either same tablespace as used for MDM Hub, or create new tablespace. |
| 19 | Oracle Temporary tablespace name | Name of the Oracle Temporary tablespace |
Pre-Install Checklist (Monitor Schema & Server) - Configuration
| D&B Account Configuration | ||
| # | Required information | Description |
|---|---|---|
| 1 | D&B Consumer key | D&B API Service consumer key |
| 2 | D&B Consumer secret | D&B API Service consumer secret |
| STP Account Configuration | ||
| 3 | STP Account ID | D&B STP Account ID |
| 4 | STP Username | D&B STP account username. All D&B change notices and seed data is delivered to the STP |
| 5 | STP Password | D&B STP account password |
| PGP Key Encryption | ||
| 6 | PGP Identity User ID | A user ID of your choice to validate the public key with D&B for file encryption (optional) |
| 7 | PGP Passphrase | A passphrase of your choice to validate the public key with D&B for file encryption (optional) |
| Reference Configuration | ||
| 8 | Reference Name | A name that is provided by the user to identify the reference. This is required to create a reference. |
| 9 | Block ID | Product or service name that is being used for Monitoring. Ex: COMPANYFINANCIALS_L1_V1 |
| 10 | Seed Data | A seed file provides a baseline of data for the Monitoring Registration. |
| Notification Schedule | ||
| 11 | Notification Frequency | The frequency at which the user can retrieve and process the notifications for the registered DUNS. (Intraday/Daily/Weekly) |
| 12 | Notification Type | The change notice type requested for the reference. Options are Update and Full Product. |
| Source for DUNS | ||
| 13 | Source Table for DUNS | The name of the table (or view) from which the DUNS numbers are processed for monitoring registration. |
| 14 | Column for DUNS | The name of the column in the source table that stores the DUNS number. |
| 15 | Column for Organization Name | The name of the column in the source table that stores the Organization Name. |
| 16 | Column for Address | The name of the column/s in the source table that stores the different parts of the address. A user can select more than one column by using a pipe '|' separator. |
| 17 | Column for Country Code | The name of the column in the source table that stores the country code. |
| 18 | Column for Last Update Date | Name of column in the source table to store last updated date |
Installation Overview
You need to complete the following steps to install the Monitor:
- Pre-Install checklist
- Creating the D&B Direct Monitor Store (Chapter 2)
- Install D&B Direct Monitor Server (Chapter 3)
Monitor application is first installed without a Monitoring Reference. Monitoring reference and the Source of DUNS for registration are updated post installation from the Configuration section of the application. For more details refer to the User Guide - in secondary menu.
Installation Components
The installation process of the Monitor includes the following components:
| Components | Description |
|---|---|
| D&B Direct Monitor and Proxy Schema | A collection of Database (DB) objects that are required for DUNS registration and notification processing. It contains metadata about the Monitor Server processing. |
| D&B Direct Monitor Server | A run-time component that manages core and common services for the Monitor. The server is a J2EE application deployed on the application server that orchestrates data processing within the Monitor Schema. It also enables integration with the source data. It can be launched on any client machine via a URL using a browser. |
Create an Installation Directory
Unzip the D&B Direct Monitor installer and Database installer [installer.zip & database_installer.zip] zip files. When you unzip the file, you will get a list of directories, subdirectories, and files.
Note: In case of problems during the installation, create an archive file of log & resource directory, and send it across to Customer Support for analysis.
2. CREATING DIRECT MONITOR STORE
This chapter explains how to create the Monitor Store on Oracle and MS SQL Database platform. Your Database administrator may have to complete the tasks specified in this chapter. Unless otherwise indicated, the instructions in this chapter apply to all supported application servers on all supported platforms. Refer Product Availability Matrix for details on all the supported platforms.
About D&B Direct Monitor Store
The D&B Direct Monitor Store requires configuration of the customer’s database with Monitor schema and Proxy schema to successfully install the application.
The Monitor schema is where data related to the DUNS registered for monitoring, database configuration, and notifications received from D&B is stored.
The notifications retrieved are processed into the landing table in the Monitor Proxy schema which can be consumed back to the source data based on customer implementation.
Relationships between Monitor and Source Data Repository
The Monitor works with only a single source schema created in the Database. A source repository is a table (or view) where DUNS numbers are kept. Availability of the source schema is a prerequisite at the start of installation. Once the Monitor Server is deployed, the application is immediately usable.
2.1 Monitor Store Creation - Overview
Installation of Monitor Store involves creation of two new database users, DB objects such as tables, functions, packages, indexes, and other necessary items that are DB dependent.
While creating a Monitor store, you need to log in as the user with system administrator (DBA) privileges. Table 2.1 depicts the sequence in which the Monitor Store is created.
Table 2.1: Steps for Installation of Monitor Store
| # | Task | Instructions |
|---|---|---|
| 1 | Creation of a new Monitor schema in the Database. | The Monitor Schema is where data related to the DUNS monitored, database configuration, notifications received from D&B is stored. |
| 2 | Associating tablespace (s) for the Monitor schema. This is required for Data, Index, and Temporary storage. |
This tablespace will be associated with the Monitor schema. Note: The Monitor setup script does not create tablespace. The associated tablespace should be an existing tablespace available in the Database |
| 3 | Creation of the Monitor Proxy Schema | Creates a proxy user with select permission on the source repository. This also stores the notifications processed in a landing table for business usage. |
2.2 Creating D&B Direct Monitor Store – ORACLE
The Monitor product bundle includes a setup_dnb_monitor.sql script that is used to create the Monitor Schema. All the database scripts are available in:
DnBDirectMonitor\database_installer\Oracle
The following are the steps to create the Monitor Schema:
- Under the downloaded product bundle, navigate to database_installer/Oracle directory.
- Unzip the database_installer.zip and navigate to the
database folder.
EXAMPLE: /home/infamdm/monitor/jenkins-monitor_data_blocks-39/DnBDirectDataBlockMonitor/database_installer/Oracle
- Start SQL*PLUS and connect to the server as SYSTEM/SYS or as a user with DBA privileges.
- Execute the setup_dnb_monitor.sql script using one of the following commands:
- SQL>@setup_dnb_monitor.sql
Setup script will walk you through the prompts listed in table 2.2.
Note: The text in brackets ([]) is the default value for each prompt. Press {Enter} to use the default value and proceed to the next prompt.
Table 2.2: Steps for DB setup of the Monitor Schema (ORACLE)| Steps | Prompt | Description | Pre-install checklist Ref item |
|---|---|---|---|
| Creating
Monitor Schema Steps 1…6 involve following activities A. Create the Monitor User Schema Connect to the new Monitor User Schema & create the Monitor Schema objects [tables, indexes, procedures, and sequence & Seed data]. |
|||
| 1 | Enter TNS name of the oracle server where DnB Direct Monitor schema will be created [ORCL]: |
TNS name (Oracle Instance ID) of the Database where you will create the Monitor User Schema |
9 |
| 2 | Enter name of DnB Direct Monitor User [DnB_Monitor]: |
Database username of the Monitor User schema |
15 |
| 3 | Enter password for DnB Direct Monitor User [dnb_monitor]: |
Database password of the Monitor User Schema. Note: By default, this password will not be displayed on the screen |
16 |
| 4 | Enter name of DnB Direct Monitor User Data tablespace: |
Database Tablespace name which you would like to associate with the Monitor User Schema. Note: In Oracle DB concept, each user has to be associated with a particular tablespace because the data created or owned by that user is stored in a specific tablespace in Oracle. |
17 |
| 5 | Enter name of DnB Direct Monitor User Index tablespace: |
Database Tablespace name which will be associated with the Monitor User schema to store the indexes |
18 |
| 6 | Enter name of the Oracle Temporary tablespace [TEMP]: |
Name of the Oracle Temporary tablespace |
19 |
| Capturing
source schema Details for Monitoring system Steps 7…13 involve Capturing Schema Details for Monitoring system |
|||
| 7 | Enter DUNS Data Schema Hostname [localhost]: |
Name or the IP address of the database machine where source schema instance is running |
3 |
| 8 | Enter DUNS Data Schema Port Number [1521]: |
Port number of Oracle Database where the source schema exists. |
4 |
| 9 | Enter DUNS Data Schema User [CMX_ORS]: |
Instance ID of the Oracle database which is used for Monitor Schema. |
12 |
| 10 | Enter Oracle Connection Type (service, sid) [sid]: |
SID or Service Name depends on how your database is setup. |
5 |
| 11 | Enter Oracle Connection (service/sid value): |
Name of the Oracle database instance ID where the source schema exists. |
6 |
| 12 | Enter Oracle Net connect identifier (TNS Name): |
TNS name (Oracle Instance ID) of the Database where you will create the Monitor User schema. |
9 |
| Creating
Monitoring Proxy User Schema Steps 13…20 involve following activities
A. Create a new Monitor Proxy User Schema in the source DB
instance |
|||
| 13 | Enter Oracle Server TNS name for DUNS Data Schema [ORCL]: |
TNS name (Oracle Instance ID) of the repository |
10 |
| 14 | Enter the name of the user with DBA privileges [SYSTEM]: |
Database User name with SYSDBA privilege on the database |
11a |
| 15 | Enter password of DBA User: |
The Sys DBA user password |
11b |
| 16 | Enter Monitor Proxy Schema User name [DnB_Monitor_Proxy]: |
This is a new user that will be created in the database. |
13 |
| 17 | Enter Monitor Proxy Schema password [dnb_monitor_proxy]: |
Password for the new proxy user. |
14 |
| 18 | Enter name of DnB Direct Monitor Proxy User Data tablespace: |
Name of the tablespace that stores the source data. |
17 |
| 19 | Enter name of DnB Direct Monitor Proxy User Index tablespace: |
Name of the Index tablespace that stores the source data
index. |
18 |
| 20 | Enter name of the Oracle Temporary tablespace [TEMP]: |
The Oracle temporary tablespace, which will be used while creating the Monitor Proxy User. |
19 |
This completes the Creating the Monitor Store. After the setup is completed, check the log file (setup_DnB_Monitor.log) by executing the following script:
[]$ vi setup_DnB_Monitor.log
This log file captures all text on screen that was executed
during the Monitor Store creation. The log file is created in the
directory in which the script is executed. Review the log file to
ensure no errors have occurred.
Note:
All errors must be addressed. If you see database errors in the
logs, resolve these first with your DBA and/or database vendor,
and then follow the steps below.
- Under the product download, navigate to database/Oracle directory
- Start SQL*PLUS and connect to the server as SYSTEM or as a user with DBA privileges.
- Drop user {DnB_Monitor} cascade
- If the proxy schema exists in a different Database Server, connect to the server as SYSTEM or as a user with DBA privileges.
- Drop user {DnB_Monitor_Proxy} cascade
Follow Creating Monitor Store to re-run the setup_dnb_monitor.sql script.
Testing Database Connection
Test the database connections from the system on which you plan to run the Monitor Server by executing the following steps:
- Create the TNS names entries for the database if not already created.
- Verify that the database connections work properly by executing the following command:
[]$ tnsping [Your Oracle SID]
For more information about TNS names entries, refer to your Oracle documentation.
2.3 Creating D&B Direct Monitor Store – SQL Server
The Monitor product bundle includes a setup_mssql.bat file that is used to create the Monitor Schema. All the database scripts are available in:
dnb_monitor/database_installer/Ms-SQL
The following are the steps to create the Monitor Schema:
- Under the downloaded product bundle, navigate to
dnb_monitor/database_installer/Ms-SQL directory - Run Command Prompt and connect to the server as SYSTEM/SYS or as a user with DBA privileges.
Setup script will walk you through the prompts listed in table 2.3.
Note: The text in brackets ([]) is the default information for each prompt. Press {Enter} to use the default information and proceed to the next prompt
| Steps | Prompt | Description | Pre-install checklist Ref item |
|---|---|---|---|
| Creating
Monitor Schema Steps 1…6 involve following activities A. Create the Monitor User Schema Connect to the new Monitor User Schema & create the Monitor Schema objects [tables, indexes, procedures, and sequence & Seed data]. |
|||
| 1 | Enter the SQL Server hostname [Ex : WIN-1E9V2GTQ5CL]: |
SQL Server hostname where you will create the Monitor User Schema |
1 |
| 2 | Enter the SQL Server Name [Ex : SQLEXPRESS] : |
SQL Server name where the Monitor schema will be created |
3 |
| 3 | SQL Server Instance to connect: |
The instance of the SQL Server that would be used for the monitor schema. |
1 & 3 |
| 4 | Enter name of DnB Direct Monitor Schema : |
Monitor database name that would be used for the meta data. |
15 |
| 5 | Enter name of DnB Direct Monitor User : |
Username for the monitor schema. |
15 |
| 6 | Enter password for DnB Direct Monitor User : |
Password for the monitor schema username. |
16 |
| Creating
Monitoring Proxy User Schema Steps 7…10 involve following activities
A. Create a new Monitor Proxy User Schema in the source DB
instance Create tables & procedures in the Monitor Proxy User Schema |
|||
| 7 | Enter name of DnB Direct Monitor Proxy Schema : |
Monitor proxy database name that would be used for the meta data. |
13 |
| 8 | Enter name of DnB Direct Monitor Proxy User : |
Username for the monitor proxy schema. |
13 |
| 9 | Enter password for DnB Direct Monitor Proxy User : |
Password for the monitor proxy schema username. Password should contain at least 1 Capital and Small letter, 1 Special Character and 1 Number |
14 |
| 10 | Enter DUNS Data Schema : |
The ORS from which the application would use the DUNS for registrations. |
12 |
3. INSTALLING DIRECT MONITOR SERVER
This chapter explains how to install and configure the Monitor Server. This is the second step in the installation process of the Monitor.
About D&B Direct Monitor Server
The Monitor Server is the run-time component that manages all the monitoring services. The Monitor Server is a J2EE application deployed on a Java Servlet Container (Tomcat) that orchestrates data processing within the Monitor Schema. The installation process can be carried out on different platforms such as Windows, Linux, and UNIX. Please refer the Product Availability Matrix [PAM] for all the supported platforms
Monitor on Apache Tomcat 9.0.37
Monitor has a pre-bundled Apache Tomcat server in the Install package. Running the Monitor on the independent server avoids conflicts or issues of having multiple applications running on the same server. This would also provide easy troubleshooting access to support incase of any issues.
Components of Monitor Server
The Data Processors are the main component of the Monitor. The
data processor component is responsible for three important
processes DUNS Number Registration, Notification Download and
Processing. Once the installation is complete, the registration
process will be invoked every five minutes for 'DUNS
Registrations' and the Notification Download/Processing is
invoked based on the schedule selected in the Monitoring
Reference (Created post installation).
D&B Direct
Monitor has three components:
- Web-based User Interface
- Data Processor
- STP Data Processor
Web-based User Interface connectivity to the DUNS Data schema is established only when you configure a Monitoring Reference. All the dashboard’s displayed in the UI are based on the data available in the Monitor Schema.
Refer to the section Running the Monitor Server Installer for details on the directory structure.
Preparing for Installation of Monitor Server
You need to complete the tasks mentioned in this section before you install the Monitor Server.
Hardware and Software Requirements
Before you install the Monitor Server, fulfill the hardware and software requirements for the Monitor Server as described in Prerequisites for the Installation. For a complete list of Platform support, refer to Product Availability Matrix document.
Obtaining Monitor License Key
To install the Monitor, you need the license key that was used to download the application bundle. You may find it in the email you received from Globalsoft with instructions to download the package. Please contact Globalsoft Customer Support (see Globalsoft Customer Support) for additional information on how to obtain a new license key.
Installing the Monitor Server
This section describes how to install the Monitor Server on the Apache Tomcat application server pre-bundled in the Install package.
Installing and Configuring Apache Tomcat
Tomcat application server is bundled with the Install package as such there are no installation and configuration steps.
Running Monitor Server Installer
Complete the following steps to create the Monitor Server:
- Under the downloaded product bundle, navigate to
application installer directory
Example - /home/infamdm/monitor/jenkins-monitor_data_blocks-39/dnb_proctor/installer - Verify and modify execute permission to the installer
folder
CHMOD -R 775 installer - run install.bat (Windows) or install.sh (Linux)
- This would prompt an interactive session to extract Monitor and start the installation process.
- Respond to the prompts given in table 3.1.
Note: The text in brackets ([]) is the default information for each prompt. Press Enter to use the default information and proceed to the next prompt.
The installer starts deploying the application on the application server and it also creates the Data source in the App server for connecting to the source schema
3.1: Steps to Create the Monitor Server (ORACLE/MS SQL)
| Steps | Prompt | Description | Pre-install checklist Ref item |
|---|---|---|---|
| 1 | Please Enter the location where you want to install D&B Direct Monitor Data Blocks |
Specify the full path location where you would like to deploy the Apache Tomcat Server. The application also would be deployed at the same location. C:\GlobalSoft\Applications\DnBDirectMonitor |
User Specific |
| 2 | Select the database type for D&B Direct Monitor Data Blocks (1) ORACLE , (2) MS SQL (1, 2) |
Select the database type to support. |
User Specific |
| 3 | Enter hostname/IP for DNB Direct Monitoring database [localhost] |
Name or the IP address of the database machine where the Monitor Schema is created |
1 |
| 4 | Enter the port number for database server where Monitor schema was created [1521] |
Port number of Oracle Database where the Monitor Schema is created. |
2 |
| 5 | Select Connection type for Monitor schema (1) SID, (2) Service Name (1, 2) |
SID or Service Name depends on how your database is setup. |
5 |
| 6 | Enter SID for database server where Monitor schema was created [orcl] |
Instance ID of the Oracle database where the Monitor schema is created. Enter SID if option 1 selected in step 5 else enter SERVICE_NAME |
6 |
| 7 | Enter Monitor database username [DnB_Monitor] |
Name of the Database username. This user schema stores the Monitor data. Note: This user is created during the DB setup while creating the Monitor Schema. |
15 |
| 8 | Enter password for {Monitor DB User} |
Database user password for the Monitor user schema |
16 |
| 9 | Enter Globalsoft license key |
Monitor product license key |
A |
| 10 | Enter hostname/IP for ORS source schema [localhost] |
Name or the IP address of the database machine for the source schema |
1 |
| 11 | Enter the port number of the database server where source schema is created [1521] |
Port number of Oracle Database where the source schema is
created. |
2 |
| 12 | Select connection type for source database (1) SID (2) Service Name (1,2) |
SID or Service Name depends on how your database is setup. |
5 |
| 13 | Enter the SID of the database where source schema is created [orcl] |
Instance ID of the Oracle database where the source schema is
created. |
6 |
| 14 | Enter FTP File Path for Exceptions, Seed, Notifications (1) {default installation path} (2) Other (1,2) |
STP file download path for Exceptions, Seed and Change Notices
for the reference created. |
Default, need to select 1 |
| 15 | Select the Keystore (1) Create new Keystore , (2) Use existing Keystore (1, 2) |
Select 1 if creating a new Keystore or select 2 to use an existing key store Not applicable when Monitor schema is installed. This should be done during application installation. |
User Specific |
| 16 | Enter password for Keystore [DnBMonitor] |
Enter the password for the Keystore. This password will be used to access the Keystore. Not applicable when Monitor schema is installed. This should be done during application installation. |
User Specific |
| 17 | Enter Username for D&B Direct Monitor Application Admin [admin] |
Enter the username to access the D&B Direct Monitor application. This would be used to login to the application post install. This should be done during application installation. |
User Specific |
| 18 | Enter Password for D&B Direct Monitor Application Admin [admin] |
Enter the password for the D&B Direct Monitor application username. This should be done during application installation. |
User Specific |
| 19 | Enter Secret Key Password for D&B Direct Monitor Application Admin [admin] |
Enter the secret key for the saved credentials. This secret key would be used to access the saved application login Keystore credentials. This should be done during application installation same for Common secret key below |
User Specific |
| 20 | Enter Common Secret Key Password for other credentials [admin] |
Enter the common secret. This secret key would be used to access all the other saved Keystore credentials. This should be done during application installation. |
User Specific |
| 21 | Enter D&B Direct Monitor Proxy Username [DnB_Monitor_Proxy] |
Enter the D&B Direct Monitor proxy schema username. |
13 |
| 22 | Enter password for admin [dnb_monitor_proxy] |
Enter the D&B Direct Monitor proxy schema password. |
14 |
This completes the installation process of the Monitor Server.
Configuring Monitor for HTTPS Installation of Monitor Server
The default configuration D&B Direct Monitor uses is http for application access. The application server can be configured for the Monitor to use https for the application access. To configure the SSL certificates on Tomcat please follow the Monitor - SSL Support Guide (document) available as a part of the download bundle.
Starting Tomcat Server
Tomcat server is installed at the location specified during the first step of Monitor Server installation. Before starting Tomcat server, the time zone setting must be verified to confirm the Tomcat server and Monitor server are configured for the same time zone. Failure to do so will cause issues with the operation of the Monitor.
By default, the Tomcat server time zone is set to “US/Pacific\”. Additional time zone parameters for US Central, US Eastern and Asia time zones are include, and are commented.
To change the Tomcat server time zone from the default:
- Navigate to {Location specified during install}/apache-tomcat-server/bin
- Edit setenv.sh (Linux) or setenv.bat (Windows) and configure the following parameter to match the time zone of the servers if not listed.
- If the desired time zone is included with the included
commented time zones, uncomment the time zone specific to your
desired location and comment out the others.
export JAVA_OPTS="-Duser.timezone=\"{set time zone}\""
EXAMPLE: export JAVA_OPTS="-Duser.timezone=\"Asia/Calcutta\""
To start the Tomcat Server, navigate to
{Location specified during install}/startTomcat.sh (linux) or startTomcat.bat (windows)Launching Monitor
You have now successfully created the Monitor Schema and deployed the Monitor Server. Once the WAR files are loaded in the application server, you can point your browser to the following URL:
http://{hostname}:{Port}/monitor/login
Replace the hostname IP ADDRESS in the URL. The login page of the Monitor appears. For the first time, login with the default administrative credentials.
Refer Configuring Monitor Server for administrative credentials. The Tomcat server uses port 4000 as default for hosting the application.
With a valid username and password, you are now ready to use the Monitor.
If the application fails to launch, please refer to Troubleshooting options in Chapter 5.
4. APPLICATION CONFIGURATION
This section guides you to make changes to the already installed Monitor setup.
Configuring Monitor Server
Upon installation, the Monitor is configured with default settings, which should be reviewed and updated as appropriate once the installation is tested and deemed successful.
The following steps are required to configuring the product.
- Login to the Monitor with following
administrative credentials
Username: {Username given during installation}
Password: {Password given during installation} - Click on the menu option Configuration.
- Navigate through the left menu option to see the configurable and required parameters in the product. Refer to the User Guide for details about each menu option.
Any changes to these parameters are picked-up by the application immediately.
Re-Installing Monitor Server
To reinstall Monitor, remove the entire Installation folder that was specified during the first step of the server installation and run the installer again.
Note: Please take backup of “store” folder or any other “Config/ log” files before the Re- installation
5. TROUBLESHOOTING
This chapter explains how to troubleshoot your installation and make changes to your application and data store after running the installation process.
Monitor Log Files
This section describes the Monitor log files on all the supported platforms.
Monitor creates the following log files:
- Monitor.log
- MonitorBatch.log
A log directory is created under the application server directory called “Monitor_log”. This log directory holds the text-based log information of the Monitor.
Monitor Log
The activities of the Monitor are carried out by three components, Web-based User Interface STP Batch Processor. The logs from each of the component are captured separately in monitor.log for web-based user interface and MonitorBatch.log for all STP components and processes.
The Monitor Logs can be viewed at the following path
{Location specified during install}/apache-tomcat-server/Monitor_log
This log file contains all the errors and messages that are generated from the application and the data processor. Each log file is set to a limit of 10 to 20 MB. Once the file reaches the set limit, another file will be created according to log4J settings. It is advisable to periodically back up the file and delete the existing log file.
Monitor Authentication
Monitor supports only local product-based authentication Local user creation is supported with the role-based security. You can create regular user or user with administrative privilege using the administrative section of the monitor application.
Setting JVM Size
If there are any memory allocation issues in the app server, check your settings. Monitor requires minimum of 2048 MB to run without interruptions.
The default JVM setting may vary based on the system configuration. If the default values are more than the suggestions below, no changes are required.
Below is the instruction on how to set/change the JVM size.
JVM Size for TomcatNavigate to Monitor Install directory specified during the installation
{Location specified during install}/apache-tomcat-server- Navigate to the bin directory.
- Open setenv.sh (Linux) setenv.bat (Windows) in a text editor.
- Set the CATALINA_OPTS variable as follows:
- export CATALINA_OPTS="$CATALINA_OPTS -Xms4096m"
- export CATALINA_OPTS="$CATALINA_OPTS –Xmx6144m"
- export CATALINA_OPTS="$CATALINA_OPTS -XX:MaxPermSize=512m"
- Save the file and exit.
6. UNINSTALLING DIRECT MONITOR
This chapter explains how to uninstall the Monitor deployed on Tomcat application server.
Uninstalling Monitor
To uninstall the Monitor, remove the entire Installation folder that was specified during the first step of the installation.
Landing Table Columns Definition
Click here to Download Landing Table Column fileUSER GUIDE
Preface
This User Guide provides necessary information and guidelines for the users of the D&B Direct Monitor (also referred to as “Monitor”) to use it effectively.
Since 2012 Globalsoft has been providing integration between D&B data services and Informatica MDM with packaged software solutions that provide Informatica MDM customers access to D&B data in a fast and easy manner. That relationship has grown over the years and expanded to encompass multiple products and services, with touchpoint across the D&B organization. You can find more information on Globalsoft’s D&B Data Enrichment Solutions at https://www.globalss.com/mdm-solutions/db-data-enrichment
Resources
Globalsoft’s website provides access to product resources, including documentation, datasheets, customer stories and best practices. To get the latest documentation for your product and additional help, please browse through Globalsoft Resources section (https://www.globalss.com/resources)
 If you have questions, please contact [email protected]
Intended Audience
This guide is meant for solution implementers responsible for using and configuring Monitor.
Knowledge of database tables and the source from which the data
is monitored is particularly important.
Content
| Chapter 1: Introduction | Describes the Monitor and its dashboard. |
| Chapter 2: Using D&B Direct Monitor | Provides an overview of the D&B Direct Monitor, its processes, components, and operations. |
| Chapter 3: Monitor Architecture | Describes Monitor Architecture and its Components. |
| Chapter 4: Troubleshooting | Explains how to resolve problems in the Monitor. |
Customer Support
You can contact the Globalsoft customer support at:
| Globalsoft Support | [email protected] |
For technical support, you may contact D&B through any of the following options:
| D&B Support Hotline | 1-866-465-3829 |
| D&B Support | support.dnb.com(submit ticket) |
1. INTRODUCTION
This chapter describes the Monitor and provides a brief introduction to its dashboards.
About D&B Direct Monitor
Globalsoft has drawn on its years of experience in deploying MDM solutions to provide fast and easy access to external data, allowing you to enrich your trusted data with even more information from industry leading sources. As organizations embrace the need to create trusted and reliable sources of information and have installed Master Data Management (MDM) solutions, they are now looking to extend these solutions by adding more information to enrich their data. In doing so, they are reaching out to suppliers of data, such as Dun& Bradstreet (referred to as D&B) to establish automated pipelines for specialized data enrichment.
Globalsoft in partnership with D&B has designed the D&B Direct Monitor (from here on referred to as “Monitor”) to keep your trusted data always updated. Globalsoft developed the Monitor to operate independently and work with any data source, not just Informatica MDM. The Monitor is accessed as a standalone web application.
How it works
The Monitor retrieves from D&B the latest updates for all registered DUNS and processes these changes into a landing table that is then consumed by a user-specific process to update your D&B data. This way, the Monitor helps to keep your trusted data the latest and greatest.
The Monitor is designed to help Subscribers of D&B Direct to:
- Register DUNS with D&B: selection and submission of DUNS to D&B for inclusion in the monitoring service
- Retrieve & Process Updates: downloading and processing of seed and update notifications related to registered DUNS
- Cancel Registration of DUNS with D&B: retire the registration of DUNS for which monitoring of changes is no longer needed
D&B Products
Following is a list of D&B Data Blocks types which are supported by D&B Direct Monitor:
| Data Block Type | Data Block Name | Block Levels/Side Block |
|---|---|---|
| Company Financials | (companyfinancials_L*_v2) | L1, L2, L3 |
| Company Information | (companyinfo_*_v1) | L1, L2, L3 |
| Hierarchies & Connections | (hierarchyconnections_*_v1) | L1, L2, Alt |
| Principal & Contact | (principalscontacts_ L*_v1) | L1, L2, L3,L4 |
| Sales & Marketing Insights | (salesmarketinginsight_L*_v1) | L1, L2, L3 |
| Diversity Insights | (diversityinsight_L*_v1) | L1, L2, L3 |
| Financial Strength Insights | (financialstrengthinsight_L*_v1) | L1, L2, L3, L4, L5 |
| Payment Insights | (paymentinsight_L*_v1) | L1, L2, L3, L4 |
| Third-Party Risk Insights | (thirdpartyriskinsight_L*_v2) | L1 |
| Ownership Insights | (ownershipinsight_L*_v1) | L1 |
Launching the D&B Direct Monitor
After a successful deployment of Monitor, you would be able to access the web user interface from the following URL:
http://{HOST_NAME_OR_IP_ADDRESS}:{Port}/monitor/loginReplace the host with your deployment details.
The login page of the Monitor will be displayed and you will need the following credentials:
- Enter Username (default: admin)
- Enter Password (default: admin)
- Click Login to access the Monitor.
The default credentials can be updated from the User Management section of Administration.
The application has a default login session timeout set at fifteen minutes. If there is inactivity on the Monitor application the login session would time out after fifteen minutes except for Job Status page, as the page has an auto refresh set.
2. USING DIRECT MONITOR
This chapter provides an overview of the Monitor, its processes, components, and operations. It also describes in detail the individual dashboard of the Monitor.
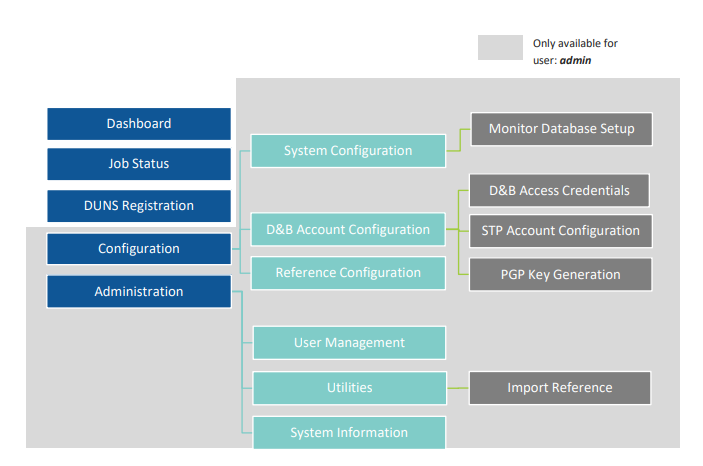
Navigation
The D&B Direct Monitor is organized with five views located on the left side of the screen, with each view providing sub-options, if applicable.
The Navigation Menu allows the user to move between Dashboard, Job Status, DUNS Registration, Configuration, and Administration sections.
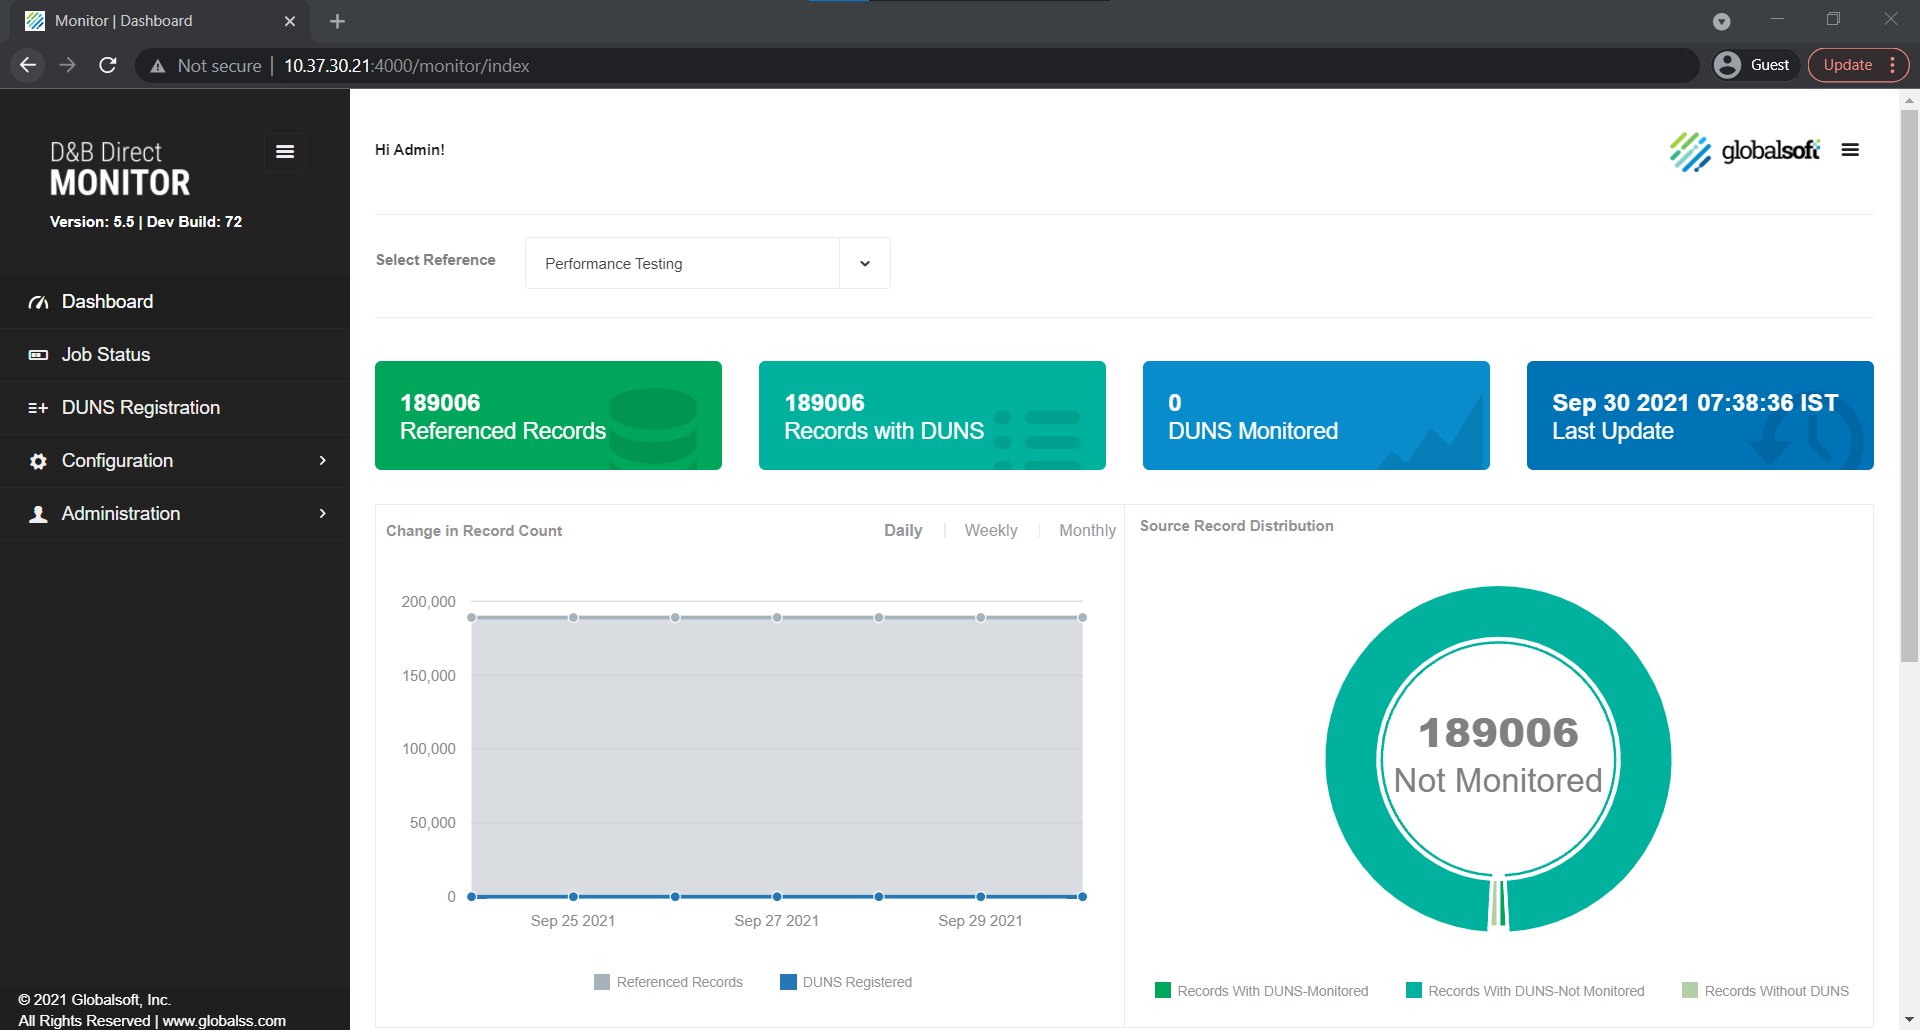
Dashboard
The Dashboard displays information and charts with detailed metrics about source records and records that are associated with a reference.
 Metrics
- Referenced Records:Total records that are available in the DUNS Source Record Count.
- Records with DUNS: Count of records from the source record count that have an associated DUNS number.
- DUNS Monitored:Count of DUNS number that is registered with a reference.
- Last Update:Timestamp for Last Job that ran for the associated reference.
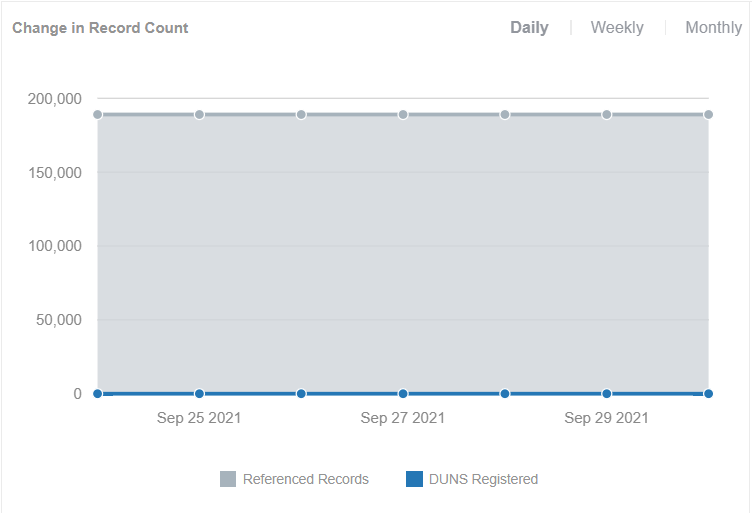
Charts
- Real time change in Record Count:A
graph tile showing Reference record count & cumulative of
DUNS registration changes over the last 30 days
Figure 2.2(a): Real time change in Record Count
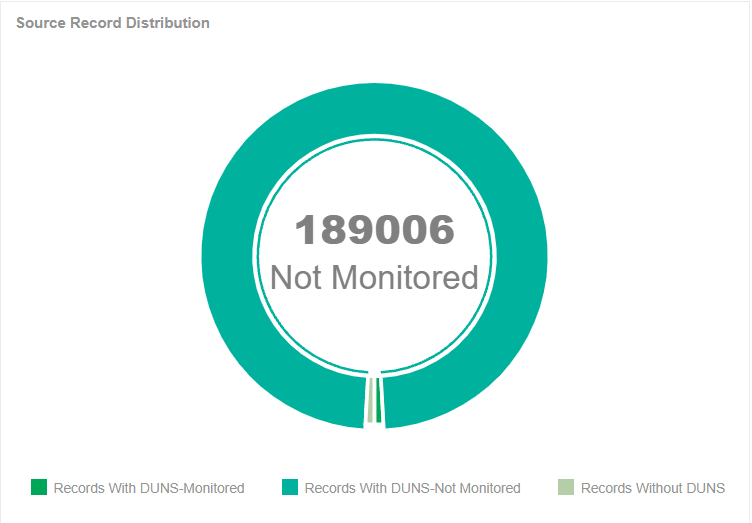
- Source Record Distribution:This helps
determine the total DUNS from the source data that are yet to be
registered. The pie chart shows the percentage distribution of:
- − Records without DUNS
- − Records with DUNS - Monitored
- − Records with DUNS - Not Monitored
Figure 2.2(strong): Source Record Distribution
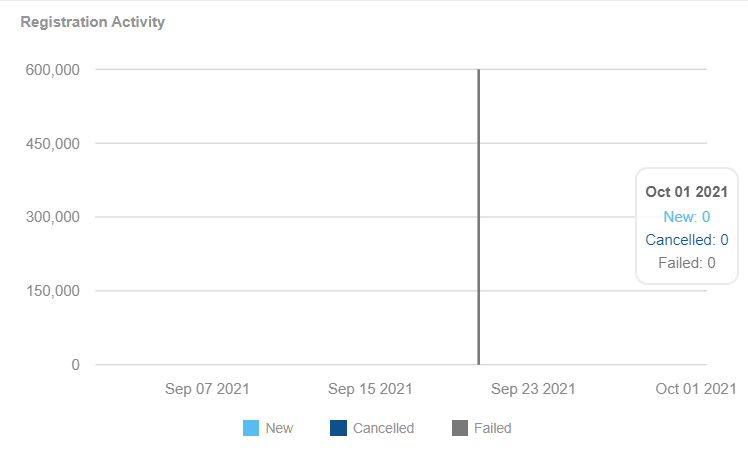
- Registration Activity:A composite graph
that represents the daily count of new DUNS registrations and
cancellations for the past thirty days. The data is available
only for a year from the current date.
Figure 2.2(c): Registration Activity
- Notification Activity:The Notification
Activity graph displays the count of Notifications received
daily, aggregated by Notification Type. The data is available
only for a year from the current date.
Figure 2.2(d): Notification Activity
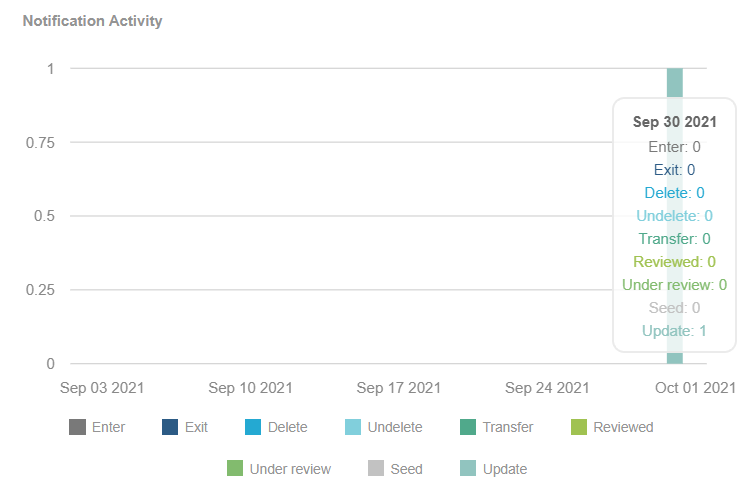
The 'Change Notifications' bar graph represents the count of change notifications that were processed on a particular day.
Job Status
The Job Status section shows all jobs that have ever been created, with their corresponding status. All jobs will be listed that have not yet been purged from the system.
The tabular report provides a view of all the Jobs that have been executed and their current status. It includes details of the job association like Reference, Job start time, Job end time, File/Record count and the estimated time of completion. This provides the user with visibility into the job type, current status and when these jobs are expected to be completed.
 Note: A job once created is triggered to run by
a component of the application called “DataProcessor”,
which has a default schedule to run every three minutes for Add
Registration and Cancel Registration.
Note: A job once created is triggered to run by
a component of the application called “DataProcessor”,
which has a default schedule to run every three minutes for Add
Registration and Cancel Registration.
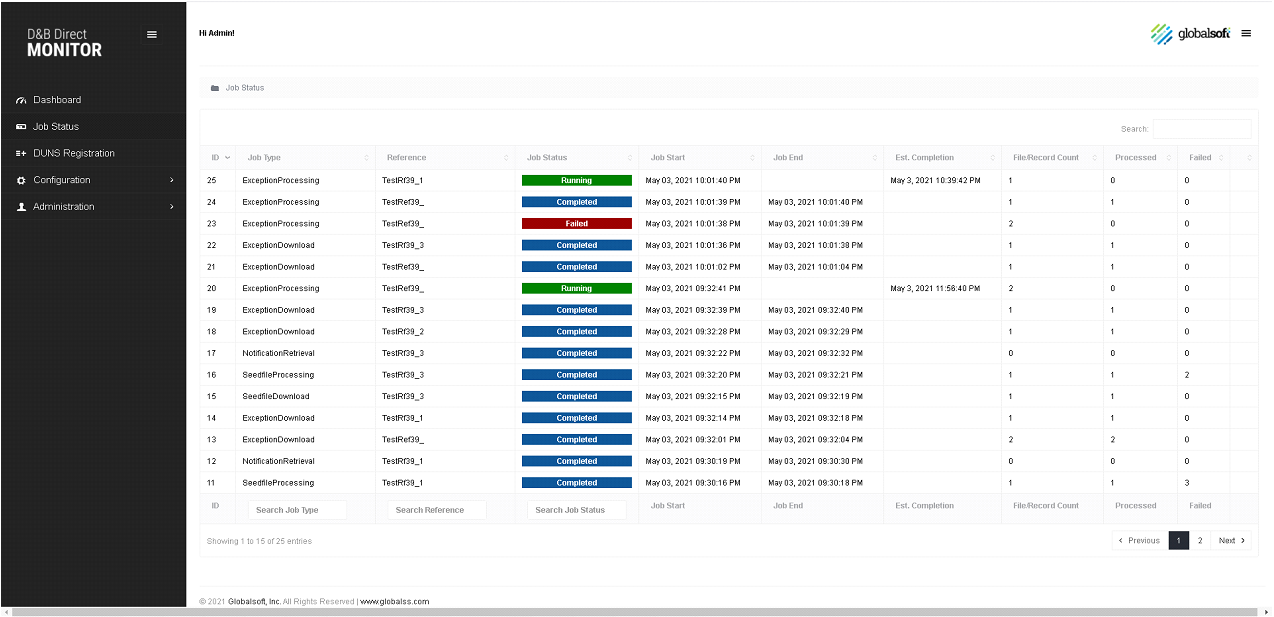
The Job Status Table captures the following details:
| Job Type |
|
| Reference | Represents the name of the Reference from which the job was triggered. |
| Job Status | Displays the status of the job. Possible options are:
|
| Job Start | Displays the date & time that the job started running (not the create date) |
| Job End | Displays the date and time that the job completed or was cancelled |
| File/Record Count | The total number of files or records included in the
job
Note: For any download jobs that field represents the number of files downloaded from STP and all other jobs it’s the count of records in the file that were processed. |
| Processed |
Represents the number of records that have been processed until the current time. The record commit count for Registration/Cancellation is 1000 and can be modified in the Monitor schema, config detailed table – DM_CONFIG_DTL |
| Failed |
Represents the number of records that have failed in the job until the current time. This is a hyperlink that presents a pop up of failed record summary by reason for count greater than 100 and individual failed records with reason for count less than 100. The pop has an export feature that allows exporting of failed records to a .csv file. Note: The hyperlink is available only for Registration Jobs and not Notification Jobs. |
| Estimated Completion |
Only available for jobs with a status that is “Running”, this shows an estimated time that the Job will be finished. It is calculated as follows: Current Time + [((Current Time - LastStartTime)/RecordCountProcessedNow) x (TotalRecordCount - RecordCountProcessed)] The Estimated Completion time is recalculated when the web page refreshes or every minute. |
| Cancel Button |
Placed in the last column of the Job status page The Cancel Job option is available for only the following job status – Created and Running. |
 , provides the ability to cancel a
registration job. Any registration job that is not in the
state of Completed, Failed, or Cancelled may be cancelled. All
batch jobs are processed in sets of 100 and when a user
cancels the Registration Job the process completes the set and
then cancels the Job.
, provides the ability to cancel a
registration job. Any registration job that is not in the
state of Completed, Failed, or Cancelled may be cancelled. All
batch jobs are processed in sets of 100 and when a user
cancels the Registration Job the process completes the set and
then cancels the Job.
Registration
In order to receive change notifications, a Monitoring Registration must be created; a separate registration is required for each product and version monitored. There are two ways to create registration, Manual Registration, which is described in this section, and Auto Registration, discussed later in this chapter.
DUNS Registration
This is the landing page of the Registration tab. This page supports multiple References which can be selected from the drop-down menu. By default, the page lists the active registered DUNS for the latest Reference. We can navigate to each monitoring Reference by clicking on it.
Figure 2.4: DUNS Registrations Page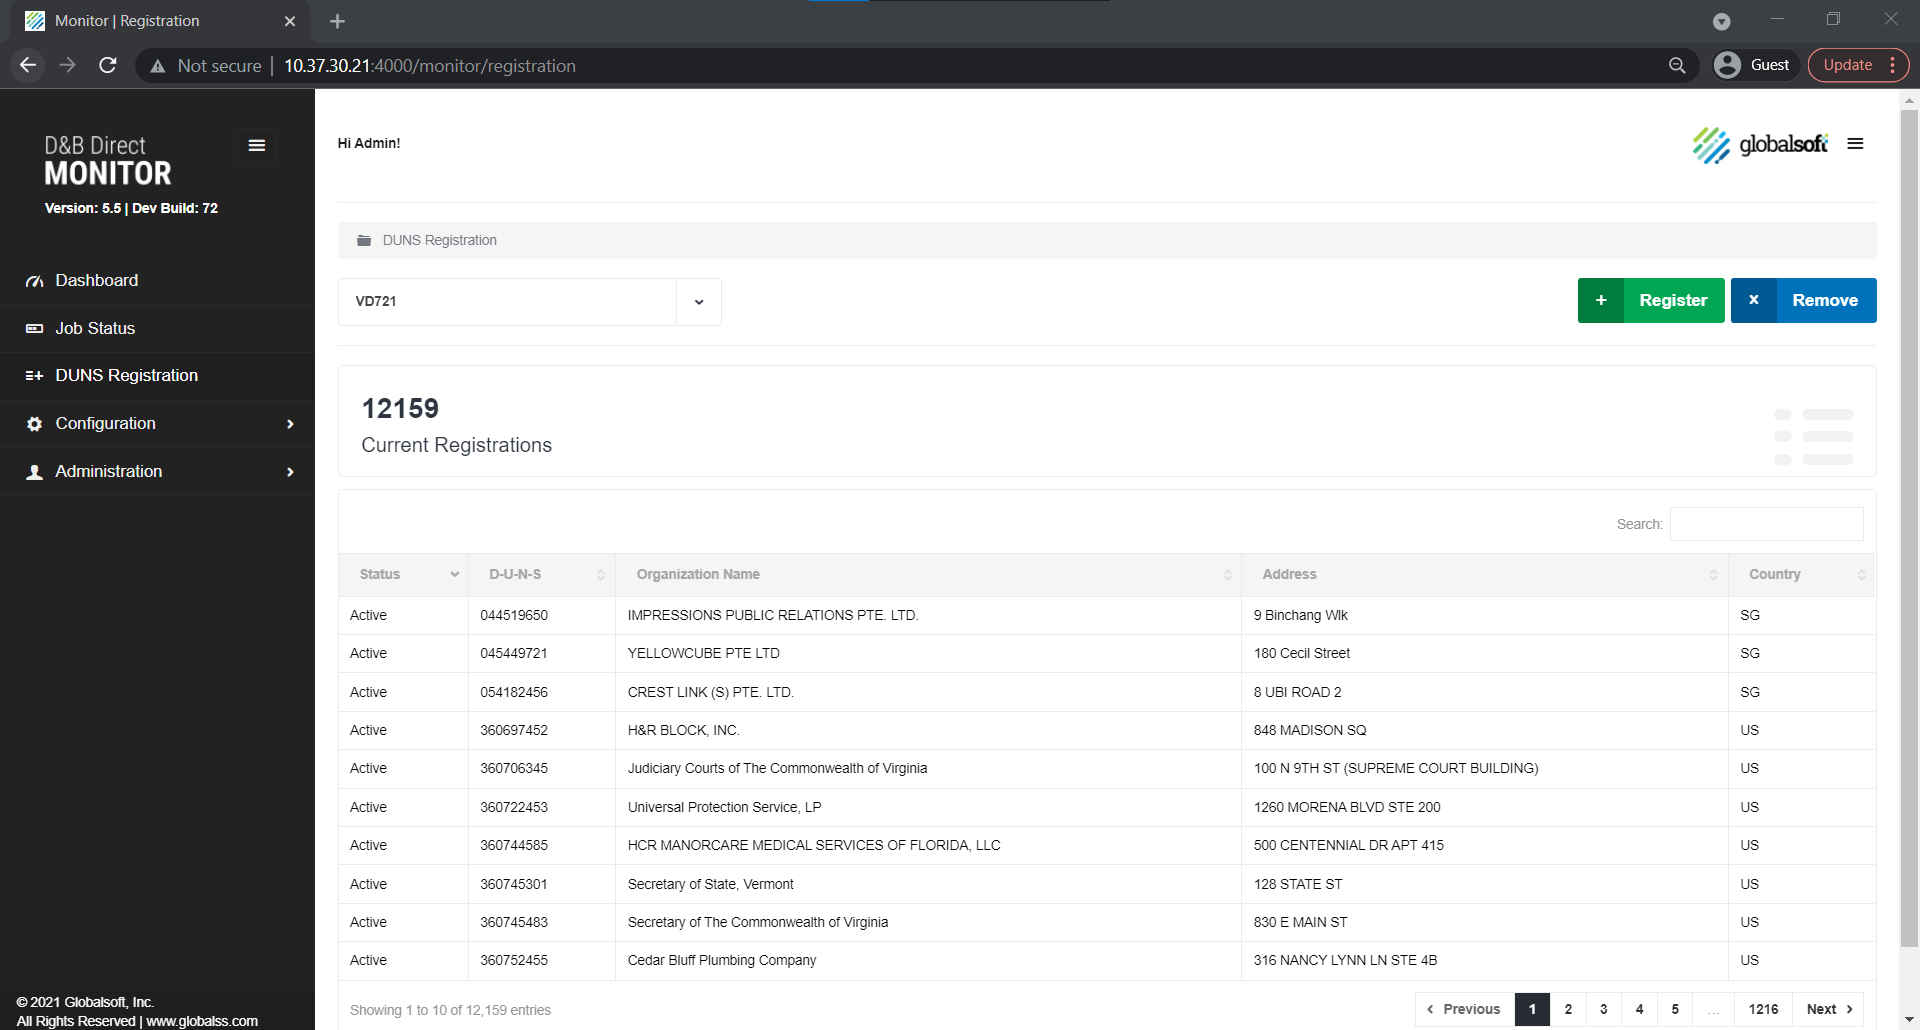
For a Reference, the registration page lists all the registered DUNS in a tabular report with associated identifying attributes such as Organization Name, Address and Country Code. The Registered DUNS table supports pagination and a user can navigate to different pages by clicking on 'Next' at the bottom of the page.
The total DUNS registered for a Reference is reported on the top left of the page as 'Registered DUNS'. To carry out other functions such as Register and Remove DUNS a user must proceed from this page.
The
registration page allows a user to carry out the following
functions:
|
|
 |
|
 |
Register DUNS
This page can be accessed by clicking on the Register button on the DUNS Registrations page. Upon accessing this page, no DUNS are listed. The User will need to request DUNS to be added by clicking on the Search button. Without a filter query provided, this will return ALL available DUNS (any DUNS in the source that is not already registered). If the user wants to filter the population of DUNS for registration, they would enter keyword in the filter box, and then click Search.
Figure 2.5: Filter DUNS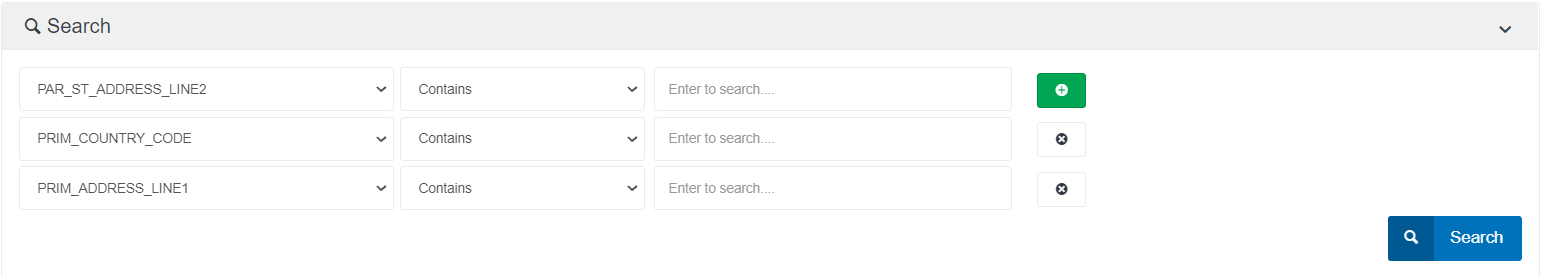
The total DUNS selected for registration is reported on the top left of the page as 'Selected DUNS'.
A user can select all the presented records by clicking on SELECT
ALL ( )button. Once the data is selected the
DUNS can be registered by clicking on REGISTER
SELECTED button.
)button. Once the data is selected the
DUNS can be registered by clicking on REGISTER
SELECTED button.
Note: Once a set of DUNS are registered it is recommended to wait for the Exception process to run and complete before running the next batch of records.
D&B API allows a maximum of 100,000 DUNS to be registered in a single call. When more than 100,000 DUNS are submitted by the user the application divides the data into files of 99,000 each and submits the DUNS recursively until all DUNS are registered.
Remove DUNS
This page can be accessed by clicking on the Cancel DUNS button on the Registered DUNS page. Upon accessing this page, no DUNS are listed. The User will need to request DUNS to be added by clicking on the Search button. Without a filter query provided, this will return ALL available DUNS currently registered for being monitored. If the user wants to filter the population of DUNS for registration, they would enter a keyword in the filter box, and then click Search.
Based on the query, appropriate data is filtered out and
presented on the UI. A user can select all the presented records
by clicking on SELECT ALL ()button. Once the data is selected the
DUNS registration can be cancelled by clicking on Remove
Selected button.
Note: Once a set of DUNS are registered it is recommended to wait for the Exception process to run and complete before running any Cancel Registration job.
D&B API allows a maximum of 100,000 DUNS to be cancelled in a single call. When more than 100,000 DUNS are submitted by the user the application divides the data into files of 99,000 each and submits the DUNS recursively until all DUNS are cancelled.
Automatic Registration
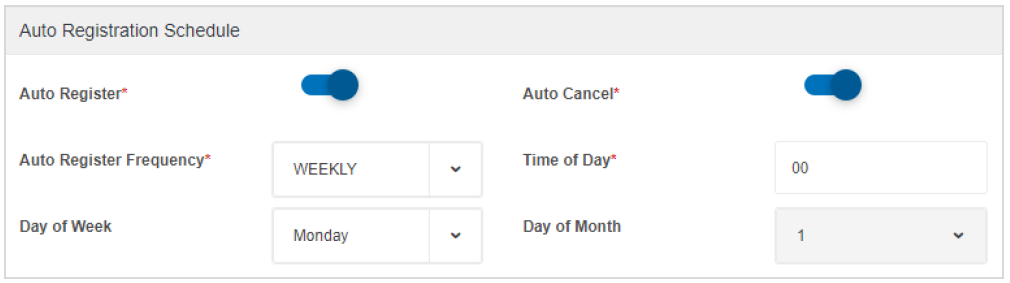
Automatic Registration is a process which provides the user an option to register the newly added records (DUNS) to the DUNS Data Schema using a scheduled process. This feature is optional, and the user needs to enable it while configuring the Monitoring reference under Reference Configuration section.
Automatic Registration feature once enabled, allows the user to schedule the process at a specific time. The scheduler can be configured Daily, Weekly, or Monthly.
The selection of DUNS for registration is based on the record’s last update date. The process captures, the last run date & time of Auto registration process and for the next run it considers the last run date as the start date to filter the DUNS from the source.
By default, the last auto registration run date is set to installation date and time. Once enabled the process would consider only DUNS that would fall in between the install date and next scheduled run.
Figure 2.6: Auto Registration Schedule
Automatic Cancellation
Automatic Cancellation is a process which provides the user an option to cancel registrations of DUNS that are no longer active in the source for DUNS table/view. The application compares all the DUNS that are in an active state in the monitoring meta data with the BO/View/Table that is used as source for DUNS and creates an Auto Cancel Registration job with the result of the delta check. These DUNS are then submitted to D&B for cancellation. The process is scheduled to run every 15 days by default and can be configured from the DB and not UI. This feature is optional, and the user needs to enable it while configuring the Monitoring reference under Reference Configuration section.
Notification Retrieval
& Processing
Seed & Change Notice Retrieval is the process of downloading the change notices and seed file for registered DUNS. These change notices are retrieved from the D&B STP server as per the configured schedule in the reference under Reference Configuration section. The retrieval job can be scheduled to run Intra-day, Daily, or Weekly based on user preference.
Figure 2.7: Manage Notifications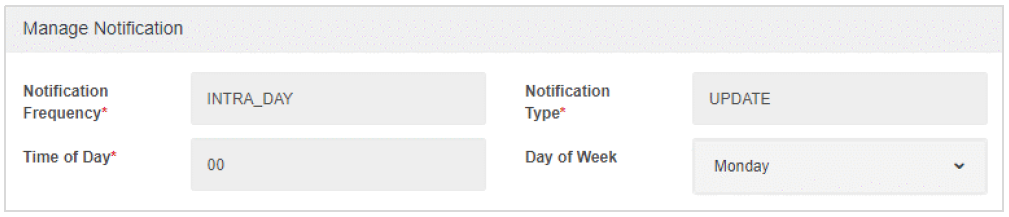
This process supports the following type of change notices
- Seed
- Update
- Transfer
- Delete
- Undelete
- Under Review
- Reviewed
Once the notifications are retrieved, it is processed into a landing table specified in the Reference. For all scheduled retrieval, the data is processed and appended to the landing table and the corresponding field in the table will have an indication on the type of change notice.
Landing Table
Landing table is an intermediate storage area used for data processing during the extract, transform and load process. In Monitor the landing table is used to store the change notices retrieved from D&B and the name of the table needs to be specified during the monitoring Reference creation. The landing table is created in the D&B Monitor Proxy Schema and the processed data needs to be moved or copied to the DUNS Data Schema anding table for further processing. We recommend just specifying the name of the landing table and allowing our internal process to create a new table as the table structure would have to meet the pre-defined requirements. For details refer to Landing Table Structure and Column Names in Appendix.
Flag Landing Table
The Flag Landing table is a mirror of the Landing Table above, also created in the Monitor Proxy Schema. Its purpose is to indicate which data elements that populate the Landing Table have actually changed. (This is necessary because some types of data will be included in Change Notices even though they have not changed).
Changed Data will be indicated with a “Y” value, with a “N” value for if data is unchanged. Note, a “N” value will be indicated if there is no data of a particular field.
The Flag Table is available for the User should they want to use it during the processing of the Landing Table.
For every Landing table (e.g., TableName), a corresponding Flag Landing Table (e.g., TableName_FLAG) is auto generated which can be viewed in the proxy schema.
Configuration
All configurable settings for the Monitor are performed in Configuration. Access to this section is only available to users with Administrative privileges. The Monitor is installed with default configuration settings entered during the installation process. Post installation, it is recommended to review the settings and modify as appropriate. It is also required to create a reference for the D&B product you want to monitor, as per your requirements.
During installation of the Monitor a build.properties file was created under the resource directory. This file consolidates all the prompts and inputs that were inserted during the Monitor Server installation process.
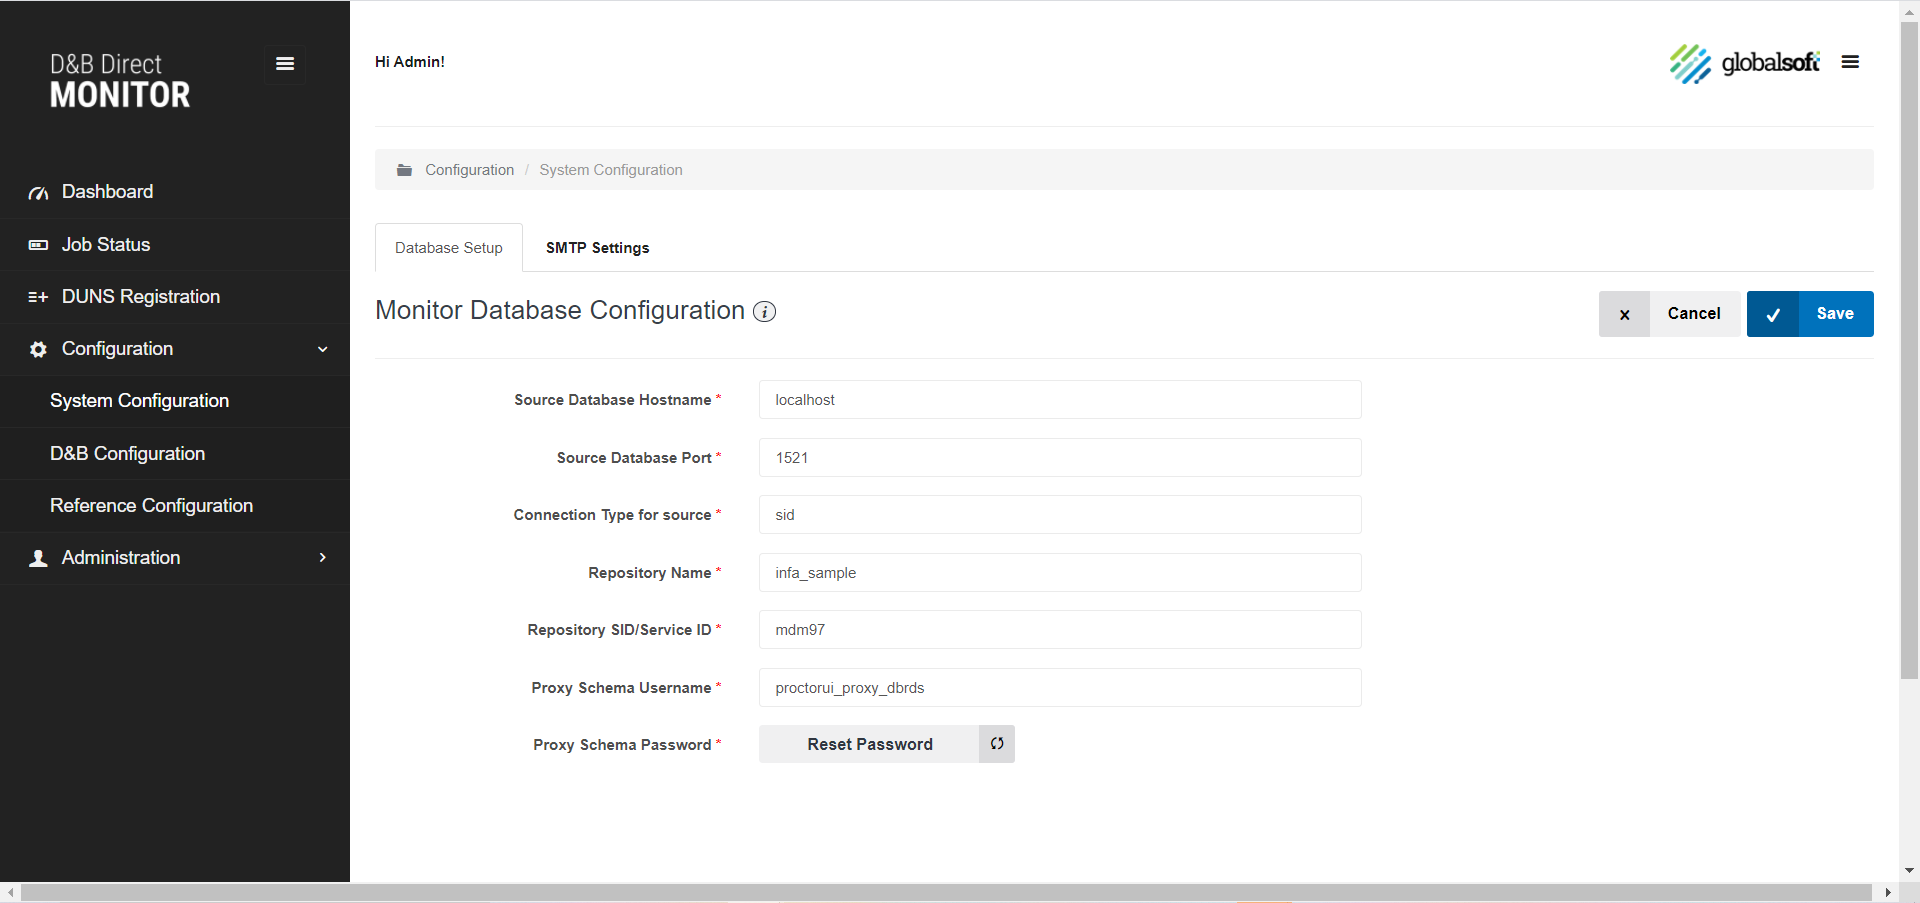
System Configuration
Database Setup
This captures the information that was provided during the installation. Any changes to the database configuration are made in this section.
Table 2.1 displays the details of the configurable parameters
| # | Field Name | Description |
|---|---|---|
| 1 | Source Database Hostname | Host name on which DUNS Data schema is stored |
| 2 | Source Database (listener) port | DUNS Data Schema listener port (default 1521) |
| 3 | Connection type for Source (schema/user) | Connection Type for DUNS Data Schema: SID or Service Name |
| 4 | Repository Name | Name of the DUNS Data schema that will be monitored by the Monitor |
| 5 | Repository SID/Service ID | TNS name of the database server where Monitor schema is created |
| 6 | Proxy Schema name | Database user in the DUNS Data schema that will be used by the Monitor to connect |
| 7 | Proxy Schema password | Password for the above Database user to be used by the Monitor Proxy Schema |
Figure 2.8: Database Setup
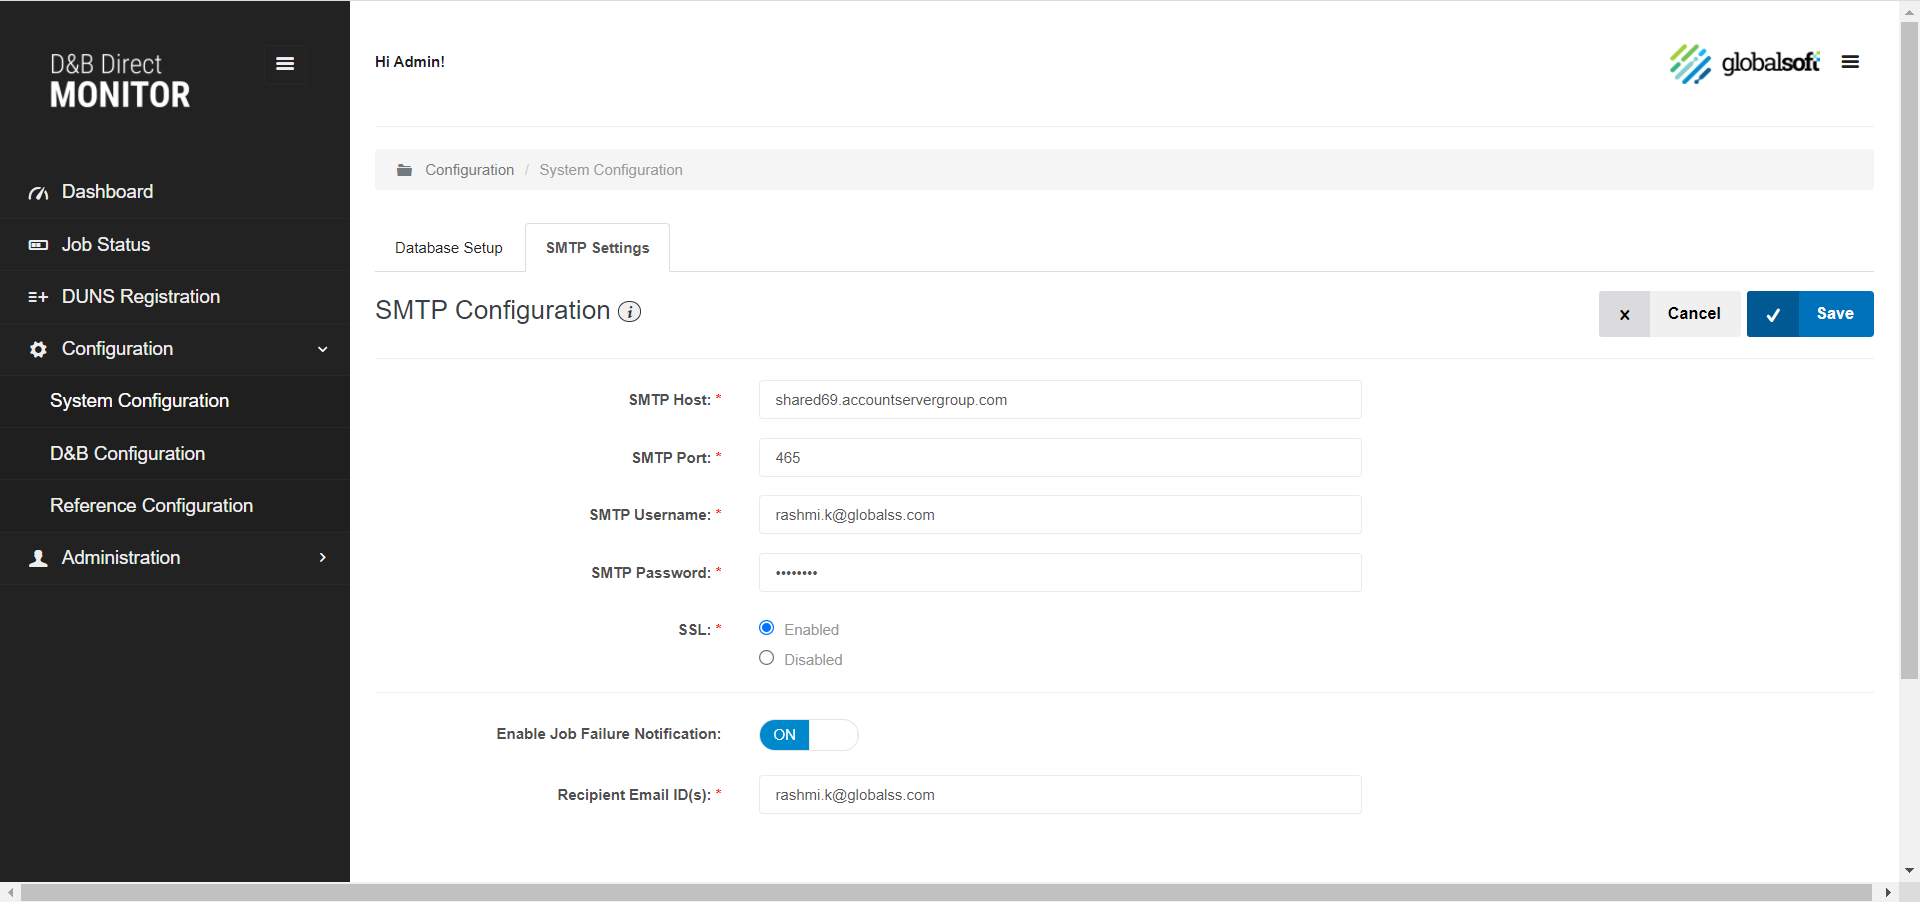
SMTP Settings
Monitor has the option to configure SMTP for the application to send out alerts to an alias or list of emails for job failures.
| # | Field Name | Description |
|---|---|---|
| 1 | SMTP Host: * | The SMTP server or host name from which the emails would be sent out. |
| 2 | SMTP Port: * | SMTP Port that the server is configured |
| 3 | SMTP Username: * | The username that would authenticate with the SMTP server |
| 4 | SMTP Password: * | The password for the username |
| 5 | SSL: * | Radio Checkbox if the server uses SSL |
| 6 | Enable Job Failure Notification: | Toggle switch to enable or disable the feature |
| 7 | Recipient Email ID(s): * | Email ID or alias of the recipient of these alert emails. The filed accepts, separated values for more than one email. |
Figure 2.9: SMTP Settings
Note: Email notification are not triggered for the following
- When failure occurs before creating the job
- Micro failures – Failure of some processes and not the whole job
D&B Configuration
D&B Account Configuration
D&B Account configuration section stores the D&B account credentials for the application to authenticate the registration request(s) with D&B Service.
D&B Account Credentials are provided by D&B for the subscribed product/service. Please contact your D&B representative if you need more information.
Table 2.3 D&B Account Access Credentials| # | Field Name | Description |
|---|---|---|
| 1 | Consumer Key | D&B API service username |
| 2 | Consumer Secret | D&B API service password |
Figure 2.10: D&B Account Configuration with Restart button to restart the Tomcat server once config saved.

Figure 2.10(a): D&B Account Restart Server tab with Restart button to restart the Tomcat server manually through UI.
STP Account Configuration
STP Account configuration section stores the D&B STP credentials for the application to authenticate with ftp.dnb.com to download the delivered Exceptions, Seed and Notifications and the option to generate the PGP keys to encrypt the notices delivered by D&B to STP.
STP Account Credentials are provided by D&B as part of the subscription to the Monitoring service and need to be setup before creating a reference.
Table 2.4 STP Account Access Credentials| # | Field Name | Description |
|---|---|---|
| 1 | STP Account ID: | D&B STP account ID |
| 2 | STP Username | D&B STP username |
| 3 | STP Password | D&B STP password |
PGP Key Generation
D&B recommends encrypting the files that are delivered through STP and the public key that needs to be shared with D&B can be generated from the UI using this section
Table 2.4 PGP Key Generation Credentials| # | Field Name | Description |
|---|---|---|
| 1 | PGP Identity User ID | PGP identity user ID of your choice |
| 2 | PGP Passphrase | A passphrase for the ID |
By passing the above values we can generate the PGP keys, download the keys and pass it on to your D&B representative/create a support ticket to get the files encrypted.
Reference Configuration
A Monitoring reference defines how a D&B Customer is consuming a specific D&B service (product). A reference needs to be created for each service that the customer plans to monitor.
This page lists all the Configured references and its associated details such as Reference Name, count of records monitored, and the last notification download date. This page also allows a user to:
- Create a new Reference
- Check Status of an existing Reference
- Edit an existing Reference
- Delete an existing Reference
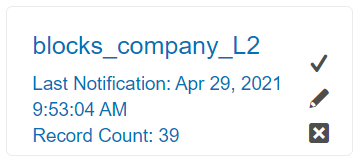
Note: A reference can be deleted only after all registered DUNS for a reference have been cancelled.
Create Reference
By clicking on Create Reference button, a new configuration screen (image below) is provided, allowing the user to create a new reference.
Figure 2.12: Reference Configuration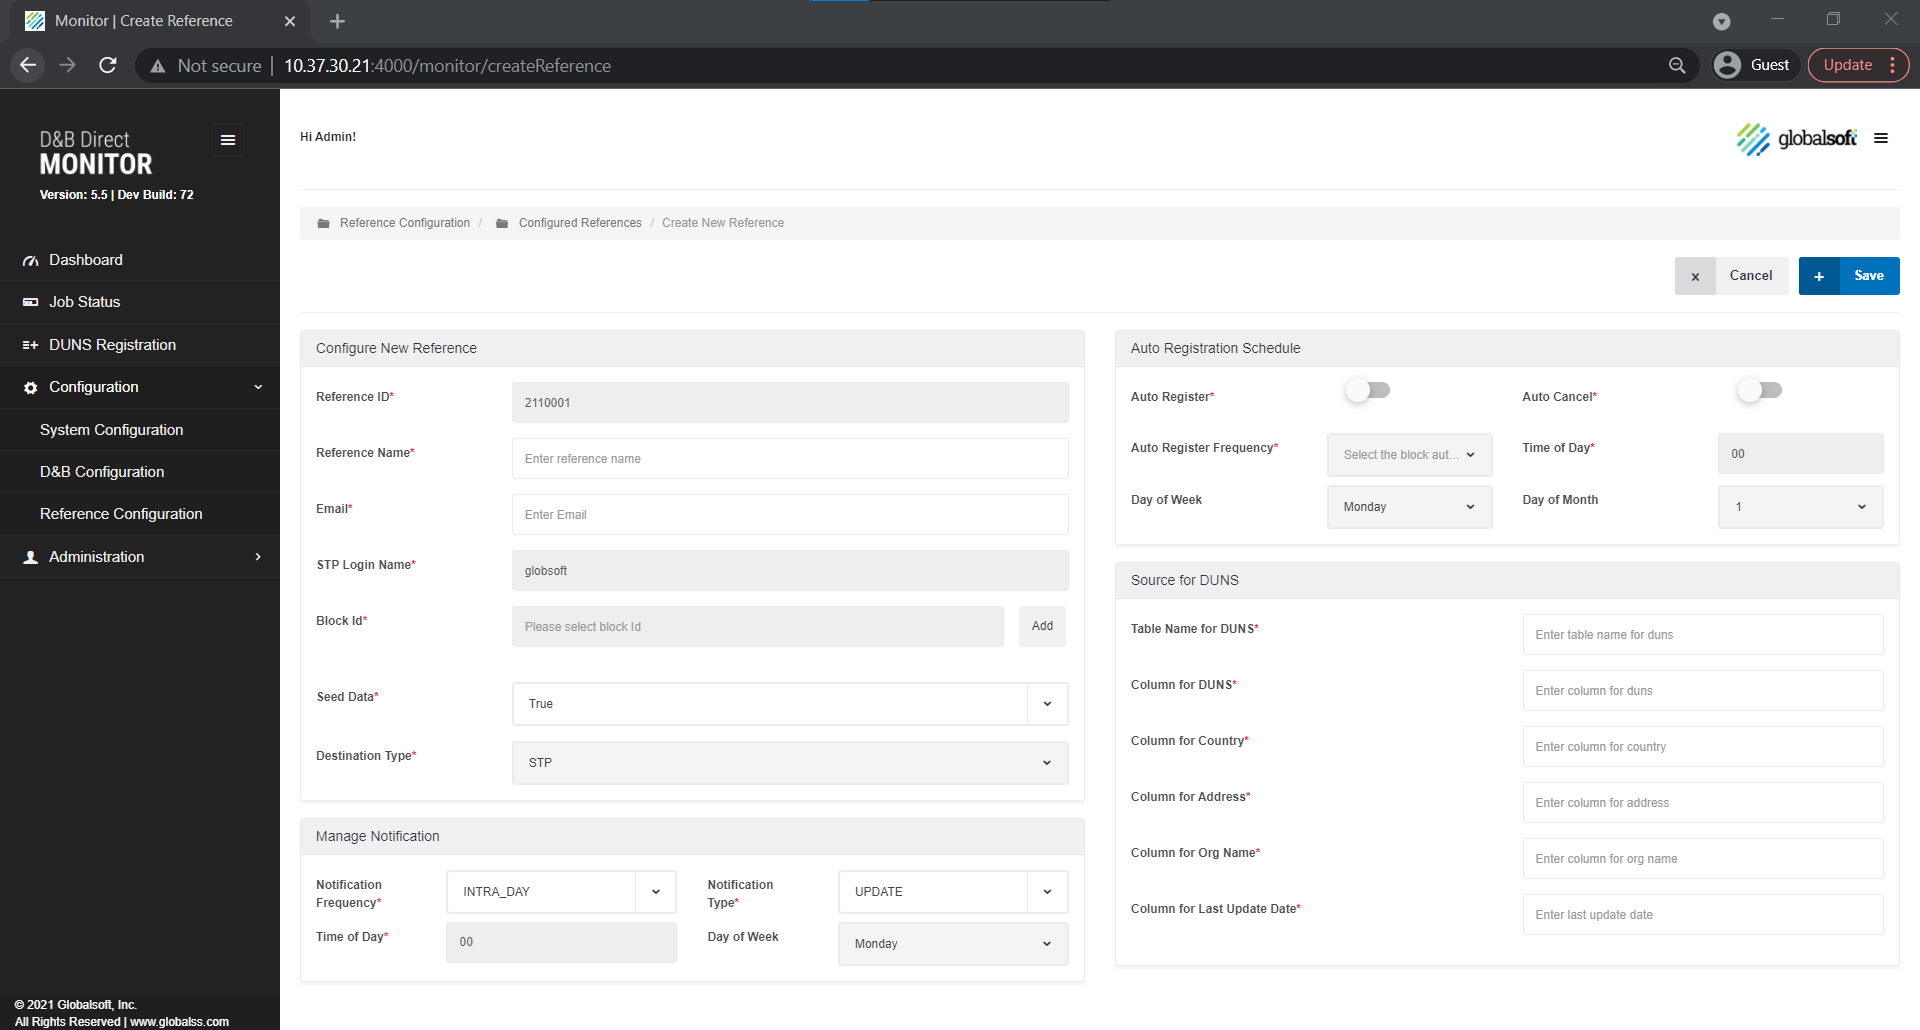
Figure 2.12(a): To select Standard or Non Standard Block IDs from the option.
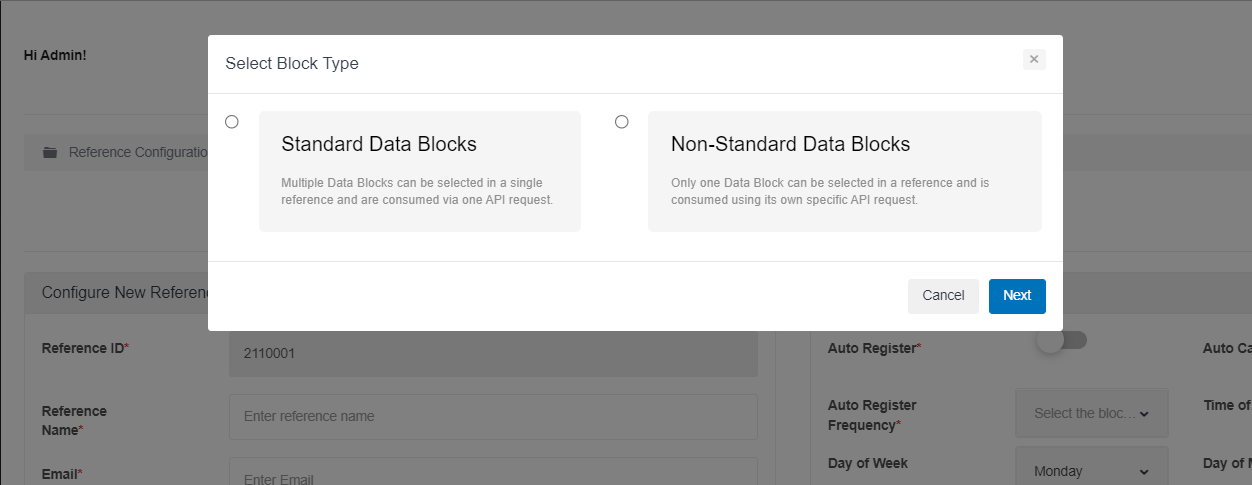
Figure 2.12(b): To select Standard Block IDs from the list.
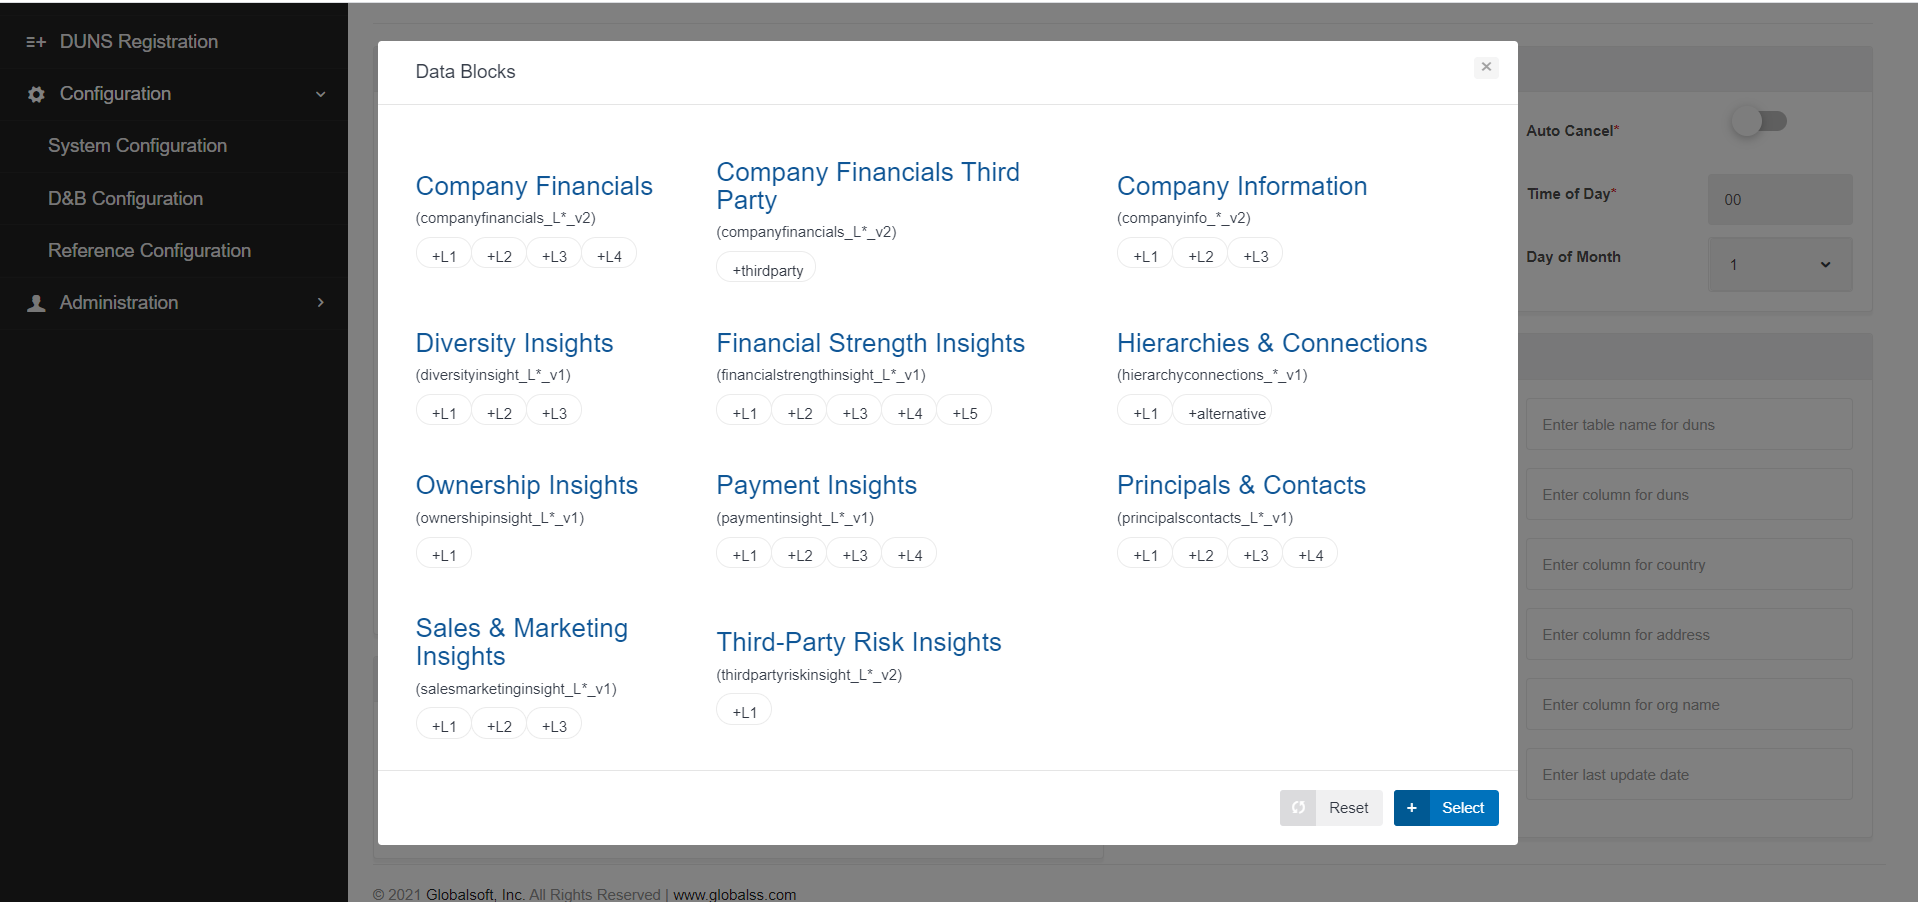
Figure 2.12(c): To select Non Standard Block ID from the list.
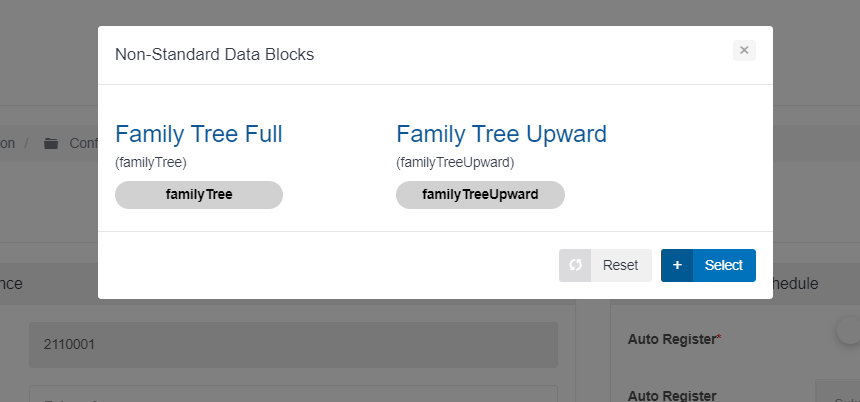
Table below lists the fields that must be entered to create a Monitoring Reference.
Table 2.5 Create New Reference
Reference Configuration
| # | Field Name | Description |
|---|---|---|
| 1 | Name* | A string used to identify the registration. The reference must be unique for each subscriber. This value cannot be changed once the registration is created. Valid contents: The field accepts alphabets, numbers and ‘_’ only Limit – 10 characters |
| 2 | Description* | A description for the registration. Provide a description that clearly identifies the purpose of the registration. Valid contents: Up to 256 characters that can include A-Z, a-z, 0-9, and the following special characters: . , - |
| 3 | Email* | Email ID to receive alerts about activity related to the reference. All alerts related to Registration, Seed File, Exception File and Notification File will be directed to this email |
| 4 | STP Login Name* | The login name of the STP Reference generated by D&B for the account. This value is auto populated from the STP Account Configuration section. |
| 5 | Block Id*/ Level / Version | The Block Id provided by D&B that identifies the product to be included in this registration. We can include multiple blocks for single level of registration. The product cannot be changed once the registration is created. |
| 6 | Seed Data* | Indicates if a seed file should be delivered. Valid values: True/False This value cannot be changed once the registration is created. If this item is needed to be changed, the user will need to delete the reference and create a new reference with the item(s) changed. |
| 7 | Destination Type* | The communications protocol used to transfer change notifications and any other material related to the registration. The product currently supports STP only. |
Manage Notification
| # | Field Name | Description |
|---|---|---|
| 8 | Notification Frequency * | Indicates how often notifications will be delivered. Intra_Day: The system is designed to check the STP for files every 3 hours starting 00:00. Daily: You can schedule the process to run at an hour of the day. e.g. 14 implies the Notification Retrieval and Processing will be triggered at 2:00 PM; Similarly, the process can be scheduled for Day of the week and hour of the day (Weekly). Note: There is a restriction of scheduling by the hour only. A user will not be able to select 14:30 and must either select 14 or 15. Limitation: When the schedule is changed from Intraday to Daily or Weekly and vice versa the change is not reflected immediately in D&B and takes about a week for the new schedule to take effect. |
| 9 | Notification Type* | Indicates the level of detail (FULL_PRODUCT or UPDATE) each change notification will include for any DUNS Number that has changed. |
| 10 | Time of Day* | Displays a time of the day |
| 11 | Day of Week | Displays the week from Monday to Sunday |
Auto Registration Schedule
| # | Field Name | Description |
|---|---|---|
| 12 | Auto Register | Provides an option to register the newly added records (DUNS) to the DUNS Data Schema using a scheduled process. When auto register is checked Column for Last Update Date needs to be populated under Source for DUNS section |
| 13 | Auto Register Frequency | The scheduler can be configured daily/weekly/monthly. |
| 14 | Time of Day | Indicates the time of the day scheduler is configured to run. |
| 15 | Day of Week | Displays the weeks |
| 16 | Day of Month | Displays the days in the month |
| 17 | Auto Cancel | Provides an option to cancel the DUNS that no longer active in the Base Object/View/Data Schema using a default scheduled process which runs once in 15 days. Note: Auto Cancel toggle can be enabled or disabled only when Auto Register toggle is enabled. |
Source for DUNS
| # | Field Name | Description |
|---|---|---|
| 18 | Table Name for DUNS* | The name of the table from which the DUNS numbers are sourced for monitoring registration. |
| 19 | Column for DUNS* | The name of the column in the DUNS Data schema that stores the DUNS number. |
| 20 | Column for Organization Name* | Used for Display purposes so the user can identify each DUNS displayed during Registration. The name of the column in DUNS Data schema that stores the Organization Name. |
| 21 | Column for Address* | Used for Display purposes so the user can identify each DUNS displayed during Registration. The name of the column/s in the DUNS Data schema that stores the different parts of the address. A user can select more than one column by using a pipe '||' separator. Example: To view the Address Line1, Town Name and Territory Name the field value would be PRIM_ADDRESS_LINE1||PRIM_TOWN_NAME||PRIM_TERR_ABV_NAME (the column names used are for representation only) |
| 22 | Column for Country Code* | Used for Display purposes so the user can identify each DUNS displayed during Registration. The name of the column in the DUNS Data schema that stores the country code. |
| 23 | Column for Last Update Date* | Used for displaying the last update date and time of the last notification run. |
Check Status
 The Reference is locked by D&B
while running some reference related API’s such as Register or
Remove DUNS. The CHECK STATUS button on the
reference configuration landing page helps to understand if a
reference is locked.
The Reference is locked by D&B
while running some reference related API’s such as Register or
Remove DUNS. The CHECK STATUS button on the
reference configuration landing page helps to understand if a
reference is locked.
If state of a Reference at D&B is locked, the resulting message will be LOCKED, else ACTIVE.
Edit Reference
 Edit Reference presents the configuration screen where a
user can edit or make changes to an existing D&B reference.
Certain value like seed data cannot be changed once the
registration is created. If this item is needed to be changed,
the user will need to delete the reference and create a new
reference with the item(s) changed.
Edit Reference presents the configuration screen where a
user can edit or make changes to an existing D&B reference.
Certain value like seed data cannot be changed once the
registration is created. If this item is needed to be changed,
the user will need to delete the reference and create a new
reference with the item(s) changed.
Delete Reference
 Delete Reference deletes the existing reference from
D&B Servers as well as from the Monitor. There are some
preconditions to delete an existing reference.
Delete Reference deletes the existing reference from
D&B Servers as well as from the Monitor. There are some
preconditions to delete an existing reference.
- The reference must not have any active registrations. If the reference has active registrations, it would return an error to first cancel the active registrations.
- Delete reference removes the reference from the monitoring Reference table, however all the DUNS registered for that Reference will be in a cancelled state in the internal tables.
Note: If the user has added an invalid Reference to the "MNTR_REFERENCE" in the Monitor schema, the delete Reference function would result in an Invalid monitoring Reference error on the UI and the Reference must be manually deleted from the MNTR_REFERENCE table.
LIMITATION: Any change in the Configuration
page requires a restart of Tomcat server for the
changes to take effect.
Administration
All administrative activities for the Monitor are performed in Administration section. Access to this section is only available to users with Administrative privileges.
User Management
The Monitor creates a single user upon installation, with the role of Administrator and a default username and password of admin/admin. Additional users can be created in User Management. Within User Management, users can be created, edited, or deleted. Each user will have a Username, a Password, and a role, either as a User or Administrator
The Monitor administrator can add users by clicking on ADD NEW USER in the user management screen. A popup screen appears with details to be filled for user creation.
Only Password and Role are editable. The Username is not changeable. If a user’s name is needed to be changed, the user should be deleted, and a new user created with the new username.”
Note: A non-admin user would not have access to the Configuration section of the Monitor.
Utilities
Utilities has two major utilities to help keep the registration data in sync with your DUNS Data schema and D&B database.
The utilities are:
- Import Reference
- Sync Registrations
- Re-process Notifications
- Restart Server
Import Reference
The Import Reference utility is used when configuring a fresh install of the Monitor with a previously created Reference. This is most useful when migrating from one environment to another.
The utility allows the user to list all References associated with the D&B Credentials and then import the reference/s that is/are relevant to that environment. The Utility will auto-fill those Reference items that are required by D&B such as Name, Product, Frequency, etc. Items not required by D&B, such as Source of DUNS, column names, and Landing Table will need to be entered in the imported Reference.
Sync Registrations
Sync registrations is a service that can be used to keep your existing Monitoring Database Schema up to date with D&B Service for an existing monitoring reference.
Sync is helpful during migration from one environment to another, especially if it is preferred to continue using the same D&B credentials and its associated monitoring reference.
Sync
can be initiated from Sync Registrations tab under Utilities
menu. It is a multi-step process:
- To initiate Sync, one must first select a reference.
- Reference Selection: A drop down from which the reference for which Sync needs to be initiated.
- Selecting a Reference will enable the Sync button for the reference.
- Clicking on Sync would initiate an “Export DUNS” request Job and will appear on the Job Status as DNBSync.
- Once the DNB Sync job is initiated a Cancel button is enabled to cancel the job if necessary.
- While the sync job is in progress it is recommended not to run any other jobs in parallel.
- Once the export DUNS is submitted, the job status would change to Request Submitted on the Job Status page and in the background a service would connect to D&B STP to download the export of DUNS file and process it to an internal table.
- Once the data has been processed, on the D&B Sync page Reject & Accept button would appear for user action in Sync Registration page.
- The page would present the user “DUNS to Add” and “DUNS to Remove” data for review.
- DUNS to Add: All the DUNS that have been registered for a Reference but don’t exist in the internal Monitor tables.
- DUNS to Remove: All the DUNS that are present in the internal Monitor tables but were not registered with D&B
- The utility allows the user to review and select the DUNS individually or select all that they would like to add and remove
- Post review, the results can be rejected, which would clear the downloaded data and the user will have to initiate sync again or submitted, which would write the DUNS to Add as an active DUNS and update the DUNS to Remove as cancelled in our internal Monitor table.
Re – Process Notifications
The Re – Process Notifications utility helps in reprocessing any of the notification files that were processed in the past without any external modification to the metadata by the user. The utility can be used for individual references and a user can select the files that needs to be re-processed.
| # | Field Name | Description |
|---|---|---|
| 1 | Reference: | The reference for which you need to re-process notifications |
| 2 | Re-Process Notification For: | The implementation allows the user to select
|
| 3 | Notification File Filter Query: | The field is optional and uses where clause filter of specify which file in the notification table needs to be reprocessed Access to NTF_FILE of the Monitor Schema is needed to understand which files need to be re-processed Note – If no value is specified the utility would re-process all historical data |
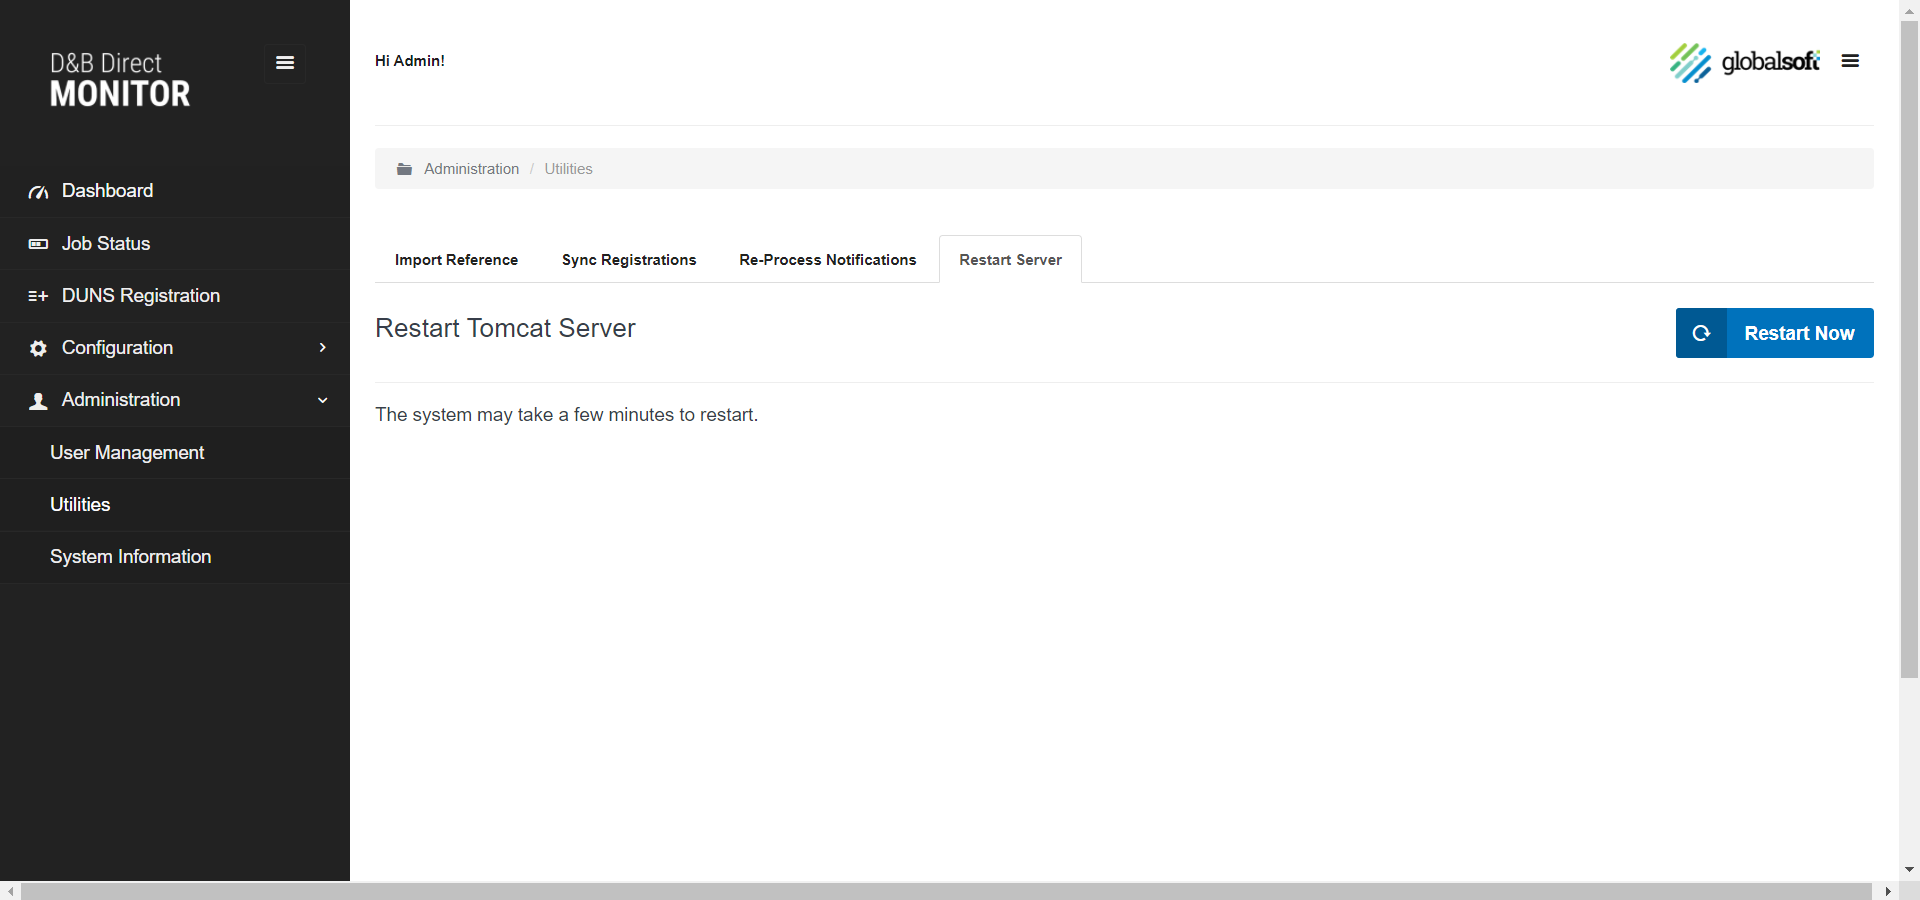
Restart Server
The Restart Server utility
helps to restart the tomcat server manually through UI.
This can be initialized by clicking on Restart
Now button.
This action takes few minutes to shut down
and restart the server.
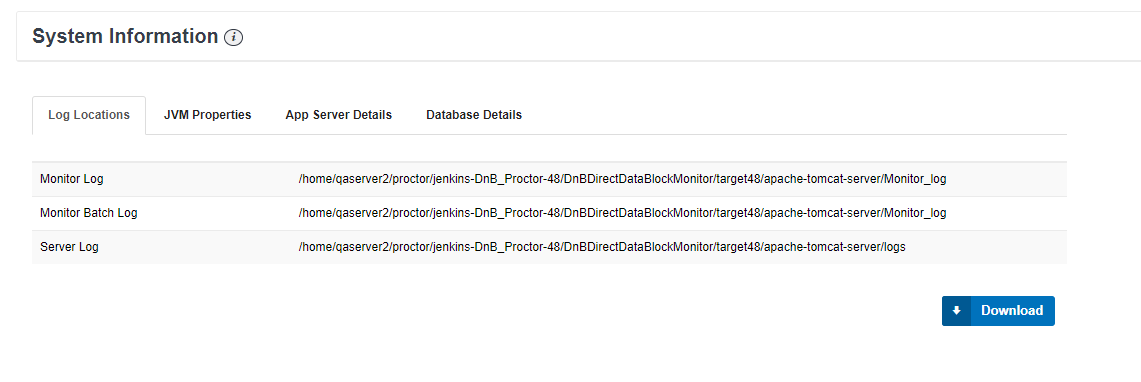
System Information
System Information section captures details about the Location of logs that capture activity of the Monitor and the bundled Apache Tomcat web server environment. This page includes a button to Download a compressed file of all the logs that can be shared for troubleshooting.
Release Details
The Release Details section displays information about the Monitor: License, Version, Build, D&B Support Hotline and as well as contact information for support.
System Information
The System Information section includes following tabs:
- Log Locations - This section has the
location of the log file and a download button to download a
compressed file of all the logs that can be shared for
troubleshooting. The following logs are created in that bundle:
- Monitor Log
- Monitor Batch Log
- Sever Log (tomcat)
- JVM Properties - This section has the details related to Java Version, memory and the Time Zone set for the Tomcat
- App Server Details - This section has the details of the application server.
- Database Details - This section has the database server details.
Figure 2.13: System Information section
3. MONITOR ARCHITECTURE
Figure 3.1: Architecture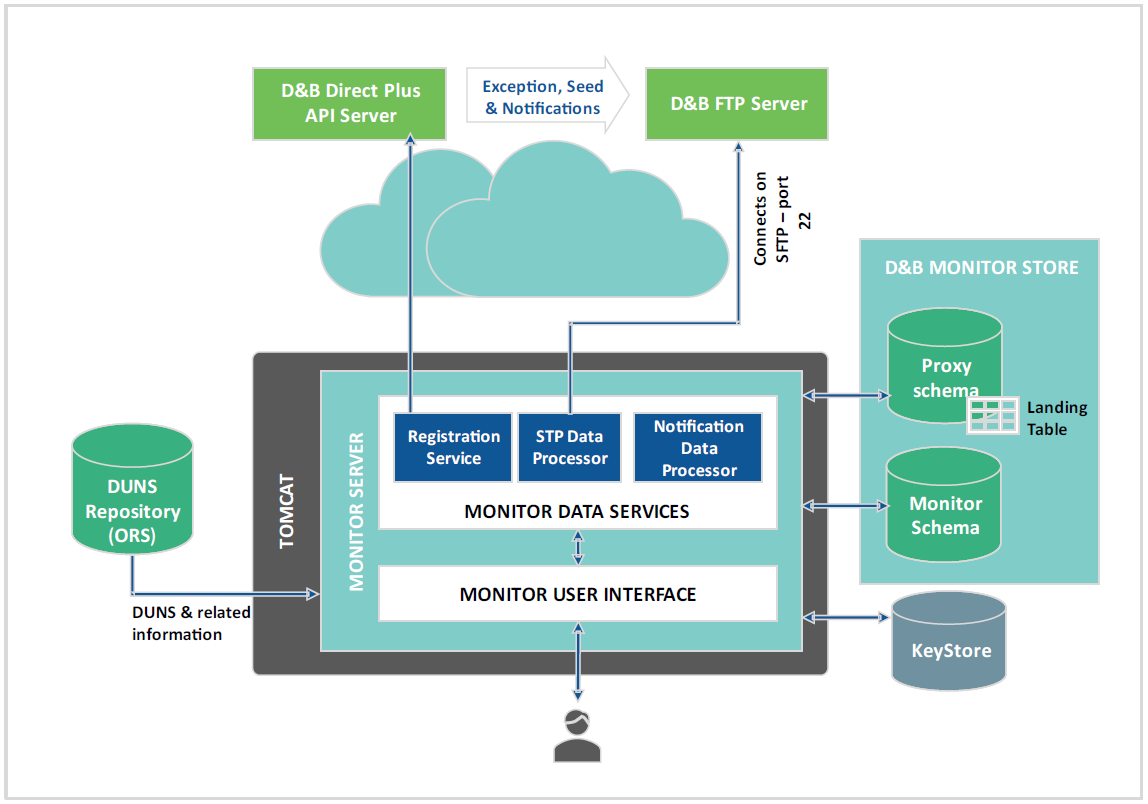
D&B Direct Monitor
Store
The D&B Direct Monitor Store is the Monitor Database Schema for the Monitor. This database stores the data required for DUNS registration. It contains metadata about the Monitor Server processing details. The Monitor works with only a single DUNS Data schema created in the Oracle Database. The Monitor Store includes a collection of DB objects such as tables, functions, packages, index and other necessary elements that are DB dependent.
D&B Direct Monitor
Server
The Monitor Server is a run-time component that manages core and common services for the Monitor. The Monitor Server is a J2EE application deployed on the application server (Tomcat) that orchestrates data processing within the Monitor Store. The Monitor can be launched on any client machine through a URL using a browser.
D&B Direct Monitor
Data Processor
This is a component that manages the Registration jobs. The data processor has two primary scheduler jobs which are executed to register and cancel registrations from D&B system. The add registration and cancel registration jobs are scheduled to run every three minutes.
D&B Direct Monitor STP
Data Processor
This is a component that manages the download and processing of STP data such as Exceptions, Seed Files and Notification Files. The Exception download and processing is triggered every 32 minutes to check for any new files to download and process. For Seed and Notification Retrieval and processing the system schedules it based on the user-configurable setting in the monitoring Reference. Once the notifications are downloaded, it is processed into a landing table specified in the reference. For all scheduled retrieval the data is processed and appended to the landing table.
Notification Processing
Seed & Change Notice Retrieval is the process of downloading the change notices and seed file for registered DUNS. These change notices are retrieved from the D&B STP server and delivered as JSON files as per the configured schedule in the reference under Reference Configuration section.
Time interval options available for scheduling Retrieval of Change Notices:
- Intraday: every 3 hours
- Daily
- Weekly
Once the notifications are retrieved, it is processed into a landing table specified in the Reference.
Seed Data
Change Notices only include changes since the date of registration and is vulnerable to missing changes made after enrichment but before registration. Seed Data addresses this vulnerability by delivering complete data at time of registration (first notification retrieval after registration)
Seed data is optional and can be defined during reference configuration. It also be generated after a DUNS is ‘undeleted’ or ‘reviewed’
Notification Process Flow
Step 1: Seed Data
Retrieval
Step
2: Seed Data Processing
Step 3: Seed Data inserted
into Landing table
Step
4: Update Notification Retrieval
Step 5: Update Notification
Processing
Step
6: Update Notification data inserted into Landing table
For all scheduled retrieval, the data is processed and appended to the landing table and the corresponding field in the table will have an indication on the type of change notice.
Landing Table Structure
The structure of a Landing table consists of a Business Column name, Database column name, and corresponding Datatypes. The attributes may differ based on the clients’ product type. We recommend just specifying the name of the landing table and allowing our internal process to create a new table as the table structure would have to meet the pre-defined requirements. For details refer to Landing Table Structure and Column Names in Appendix.
4. TROUBLESHOOTING
This chapter explains how to troubleshoot and redeploy the Monitor to reflect the changes made to the configuration.
D&B Direct Monitor Log
Files
The Monitor log file can be downloaded and shared with the support team by accessing the System Information tab under the Configuration and Setup section of the Monitor UI.
The logs can also be accessed by navigating to:
This log file contains all the errors and messages that are generated from the Monitor. It also includes any other anomalies encountered from the UI context.
Each log file is set to a limit of 10 MB. Once the file reaches the set limit, another file will be created according to log4J settings. It is advisable to periodically back up the file and delete the existing log file.
D&B Direct Monitor –
Failed to load data
When a new view or DUNS Data schema is added to the database the Monitor would not recognize the view or schema by default. Due to this, data for that schema would not be visible to run registrations in the reference.
This issue can be fixed by ensuring that every time a new view or DUNS Data schema is created, SELECT privilege should be granted on the new view or schema to the Monitor Proxy User.
Locked Reference
It has been observed that a reference gets locked for further registrations though there are no registration jobs running due to a D&B error. When a reference is in a locked state with no registrations running manual intervention is needed to get them back to an ‘Active State’ for which we must contact D&B.
Notification Frequency
Any change in notification frequency in the application takes effect after a tomcat restart for the Monitor application, however D&B has a lag in updating the Notification Frequency of up to 5 days and the changes will take affect post that. This scenario is valid for change in schedule from Intraday to Daily or weekly and vice versa. Just changing the hour of the day does not have any impact to D&B configurations.
EXAMPLE: If the initial schedule was Intraday
and is then changed to Daily, the application will look for
change notices daily, however D&B will still generate change
notices at an Intraday frequency till the new schedule takes
effect.
5. APPENDIX
Firewall Configuration
Monitor is designed as a standalone application and does not access any external URLs for its operations other than the end points of D&B Services mentioned below.
https://plus.dnb.com/*
https://ftp.dnb.com/*
Connection to ftp.dnb.com via SFTP port 22
Port 4000 on which the application runs on tomcat
These URLs or end points the application accesses and must be exempted from the internal firewall settings.
Data Blocks - Landing
Table Structure & Column Names
Please refer to the corresponding spreadsheet Landing Table Columns.xsls included in the download package.